实验一
Python基础语法学习总结
实验目的
学习Python基本语法
实验场地与设备
线上
实验方式
阅读教程与程序设计
实验设计
Python语言基础
\[
图1.1 Python基础语法学习实验设计
\]
实验内容
1. Python语法总结
1.1 Python基本语法
(1) 基本语句
①
首先是输入输出语句,输入语句比较简单为name=input(),基本输出语句为print(),拼接输出使用逗号。
② 注释采用# 进行书写
③
代码风格:Python采用的是缩进式代码风格,所以对于复制粘贴比较不友好
④
条件判断语句:if 条件1 :...elif 条件2 : ... else : ...
⑤ 循环语句:
第一种是for循环:for x in []:
for x in ...:
循环就是把每个元素代入变量x,然后执行缩进块的语句
第二种是while循环:while 条件判断语句 :
break、continue和java中用法相同
(2) 数据类型
①
整数: 对于很大的数,很难数清楚0的个数。Python允许在数字中间以_分隔。
② 浮点数: 允许使用科学计数法定义
③
字符串: 在Python没有严格要求''和""的区别在,也就是说没有区分字符和字符串使用二者没有任何区别。
转义符和Java中保持一致
Python允许用r''表示''内部的字符串默认不转义
④ 布尔值:
在Python中要注意:True、False要注意开头首字母大写。
可以进行与、或、非的运算,运算符分别为:and,or,not
⑤
空值: 空值用None表示,意义与Java中的null相同。
⑥ list:
list是Python内置的一种数据类型,list是一种有序的集合,可以随时添加和删除其中的元素。此数据类型在Java的实用类中有封装。list和数组很像,声明方式如下:
1 classname = ['老六' ,'老八' ,'老九' ]
想要调取其中的某个元素也和数组一致,赋值修改等也相同
1
2
3
4
5
6
list: append('Elem') # 在末尾添加新的元素 insert(i,'Elem') # 将元素插入指定位置 pop() # 删除末尾元素 pop(i) # 删除i处的元素 len(list) # list列表的长度
list允许混合类型,也允许list嵌套,从而出现多维数组。
⑦ tuple
tuple被称为元组,其最大的特点就是不可修改,声明方式如下:
1 classname = ('老六' ,'老八' ,'老九' )
tuple在定义时要确定元素个数,这里有一个问题,在定义只有一个元素的tuple时,Python语法会认为这是一个小括号,因此在定义一个元组的tuple时,要加一个,避免歧义。
⑧ 字典(dict)
字典全称为dictionary,在Java实用类中叫hash
map。其由键值对(key-value)组成,查找速度快。
下面是一种初始化方法:
1 d = {'Michael' : 95 , 'Bob' : 75 , 'Tracy' : 85 }
也可以放入指定的key中:
查找value:
key与value是多对一的关系,key需要是一个不可变对象保证key做hash运算后的唯一性。如果多次对某个key赋值,后边的value会覆盖前面的value
提供了几个函数:
通过in来判断key是否在dict中,返回值为布尔值,格式为:key in dict
get()方法,dict.get('key',空返回值)key不存在时返回空返回值,空返回值可自定义,如果没有定义的话返回None
pop()方法,删除key,如果有value也一并删除,格式为pop('key')
⑨ 集合(set)
set是一组key的集合,集合特点;无序性、确定性、互异性
要创建一个set,需要提供一个list作为输入集合:
方法: add(key)添加一个新的元素
remove(key)删除一个元素
两个set可以做交运算和并运算: 交运算:s1&s2
并运算:s1|s2
(3) 理解变量
在Python中变量仅仅是一个一个字母,变量与所对应的值之间的关系靠指针联系起来的。所以很重要的一点就是:当我们使用变量时,更多的要关注变量指向的东西,他可能是值,也可能是一个函数,也可能是一个变量
1.2 模块
(1) 模块导入
(2) 模块下载
模块下载有比较复杂的方法,也有比较傻瓜式的。先说复杂的,使用Python中自带的pip包管理工具,用命令:
但是使用pip需要事先了解要导的包的名字,而且不能批量导入,而且在Python编程里也有编程一分钟,导包一小时的说法。pip下载第三方库的源可能会很慢或者失效,需要会自己添加国内的高速镜像。
傻瓜式的导包,例如在pycharm中可以直接在代码中写出自己需要的包,然后交给pycharm自己去下载,或者用Anaconda提前构建好的Python的库环境。
1.3 函数式编程
(1) 函数
① 函数定义
在Python中定义函数为,def 函数名(参数):然后,在缩进块中编写函数体,函数的返回值用return语句返回。
1)空函数:
在这里pass作为占位符,表示跳过,也可以用在if的缩进块。
2)参数限制:
1 2 if not isinstance (x, (int , float )): raise TypeError('bad operand type' )
实际上参数限制就是定义一个报错,isinstance()判断数据类型,如果不是就提出一个错误。
作为一个弱类型语言,定义这一步是很有必要的,有助于读懂代码。
3)返回值:
Python允许返回多个值,其返回的实际上是一个tuple元组,但是也可以用两个变量接收。
② 参数定义
在Python中函数参数的定义也比较灵活,提供位置参数、默认参数、可变参数、关键字(key)参数等
1)位置参数:位置参数指的是参数在传入时,实参和形参有着严格的位置对应关系,为常用参数形式。
2)默认参数:默认参数是指在位置参数的基础上为其添加默认值,有默认值的参数为默认参数,没有默认值的参数为必选参数
基本定义形式如下:
1 2 3 def my_def (a,b=1 ): a=b+1 return
需要注意的是:
默认参数必须在必选参数后边,否则会无法辨认是否输入必选参数,从而报错。
默认参数的默认值一定是不变对象 ,由于Python中的变量定义为指针指向,会导致可变对象值发生变化
3)不可变对象有:数值类型、字符串、tuple元组、None等
4)可变参数:可变参数指的是参数的数目不固定,定义形式:
1 2 3 4 5 def my_function (*v ): sum = 0 for vi in v: sum +=vi return sum
在可变参数中传入的所有参数将作为一个tuple被接收,该tuple的变量名为函数在定义时的形参名,定义时的需要在参数名前加一个*。
5)关键字(key)参数
此处的关键字和c语言中的关键字并不是一个意义,而是在dict中的key的意义。即在传递参数时,同时传递键(key)和值(value),Python会自动封装为一个dict。
1 2 3 def my_function (**v ): print (v) return
6)命名关键字参数
在关键字参数上,进一步限制传入的key的命名,就有了命名关键词参数:
1 2 def person (name, age, *, city, job ): print (name, age, city, job)
这里需要一个*区分位置参数与命名关键字参数,如果在这之前有可变参数,那么就不需要加*。
7)参数组合
在一个函数中使用多个参数要保证其中的顺序,依次为:必选参数、默认参数、可变参数、命名关键字参数和关键字参数。
1 2 def onefunction (a,b,c=0 ,*args,job,city,**kw ): pass
tips:
使用*args和**kw是Python的习惯写法。
可变参数和关键字参数有一点层级的感觉,中间包裹的是命名关键字参数这个比较尴尬的参数。
③ 递归函数
写法与Java相同。
(2) 实用方法
① 切片
切片是一个针对tuple和list方便地取元素的方法,语法规则:
当起始坐标为0时可以省略;步长为1时可以省略。
② 迭代
迭代是循环的增强,但是想要弄清迭代,需要知道两件事:一个是能不能迭代,一个是迭代出的数据是什么
想要知道一个数据能否迭代可以通过一个函数来完成:
1 2 3 from collections.abc import IterableL=[1 ,2 ,3 ] isinstance (L,Iterable)
迭代出的是什么,和要迭代的对象的储存方式,要特殊记忆一下dic。
③ 列表生成器
一种快捷生成list的方式,一个例子如下:
1 [x * x for x in range (1 , 11 )]
如果想要筛选生成的值,可以在for后加上if作为筛选条件 ,注意这里是筛选条件,
因此这里和平时的if else并不是一个东西。
1 [x * x for x in range (1 , 11 ) if x % 2 == 0 ]
④ 生成器
生成器是一种惰性的计算方式。包含yield关键字,当一个函数包含yield关键字时,他就成了一个generator函数。yield在generator函数中起到了一个return的作用,即到yield便返回。
在调用时,使用一个变量接受一个generator对象。使用next()函数依次获得下一个返回值。
⑤ 迭代器
区分Iterable和Iterator
Iterable是可迭代的,是直接可用于for循环的。包括dict、list、tuple、set、str、grenerator。
Iterator是迭代器,是直接可用于next()函数的,生成器都是Iterator对象,集合数据类型可以通过iter()获取Interator对象。
(3) 函数式编程
函数式编程是一种面向过程的编程思想,实际上是将复杂问题转化为一个个函数。
在Java的函数定义中,除去void类型不返回值,其余的都需要返回值。因此也就经常存在,使用一个变量接受函数值:
1 2 3 4 int function (x,y) {return ;} int a=function(x,y);
那么是不是存在一种可能,我们可以将函数嵌套,让函数调用函数,让函数返回函数,彻底抛弃变量?
抛弃变量、只有函数就是彻底的函数式编程
① 理解高阶函数
之前有过变量名和值的理解,在Python中变量名和值是一个指针指向的关系。同理,函数名和函数也是这样的,函数名也是一个变量。也就是说,我们可以通过函数名,拿到函数体。也就是说函数名是什么并不重要,我们看中的是函数体。
绘图1
那么设想一种情况,现在我们定义了函数f2,那么我可以随便写一个函数,然后返回一个变量f2,那么实际上我就拿到了函数体。
1
2
3
4
5
def f2 (a,b ): return a+b def f3 (): return f2 print (f3()(1 ,2 ))
image-20220909173741530
然后我们在设想另一种情况,现在我们定义了另一种情况,我们在一个函数中写了一个f1作为局部变量,那么我就可以传入变量f2,然后就相当于传入了函数体。
1 2 3 4 5 def f2 (a,b ): return a+b def f1 (a,b,f ): return f(a,b) print (f1(1 ,2 ,f2))
现在就可以进行一个区分:
f代表函数名,是变量f()代表数值,是函数的返回值,返回值是一个量
高阶函数,就是让函数的参数能够接收别的函数。
实用的几个函数,有必要查表即可
② 返回函数
同上文理解,只不过是将一个函数嵌套入了另一个函数
③ lambda表达式
与Java中语法相同,目的是为了简化返回函数嵌套
1.4 面向对象编程
(1)类和对象
创建类:语法如下
python的类非常随意,几乎可以不定义就能用。在类中自带有一个构造函数__init__(),此函数可以重新定义
生成对象:
(2)访问权限
如果要让内部属性不被外部访问,可以把属性的名称前加上两个下划线__,在Python中,实例的变量名如果以__开头,就变成了一个私有变量(private),只有内部可以访问,外部不能访问。
此外,__ __这种变量都是特殊变量,在不清楚的时候不要随便乱改
(3)继承和多态
和Java中的思想完全相同
(4)常用变量和方法
① __slots__
用这个变量可以起到参数列表的功能,可以在一定程度上限制参数的变量名,用turple进行限定
② @property
注解编程,可以起到一个简化定义setter和getter函数的作用。@property注解在getter方法上 ,然后会自动生成
@函数名.setter
的注解,但是要注意的一点是,在getter中就不能使用函数名作为自身的调用值,否则会出现无限的调用,产生爆栈。
③ 多继承
与Java相同
⑤ __str__:和Java中的toString方法相同
1.5 错误调试
(1)错误处理
参照Java中,对比来学习即可:
两种方法,一是尝试,二是抛出,尝试采用:
1 2 3 4 5 6 try : pass except baseexception : pass finally : pass
抛出采用raise关键字
(2)测试
①
断言:assert的意思是,表达式n != 0应该是True,否则,根据程序运行的逻辑,后面的代码肯定会出错。
如果断言失败,assert语句本身就会抛出AssertionError
② 断点:在强大IDE的辅助下,使用断点调试应该是最简单的。
2.实践
2.1 石头剪子布
使用random包中的random函数和条件控制语句,模拟两个电脑互相猜拳:
1 2 3 4 5 6 7 8 9 10 11 12 13 14 15 16 17 18 19 20 21 22 23 import randomdef win (pc,cc ): if (cc==1 and pc==2 ) or (cc==2 and pc==3 )or (cc==3 and pc==1 ): print ("电脑一输" ) elif pc==cc: print ("平" ) else : print ("电脑二输" ) def computer_choice (): cc=random.randint(1 ,3 ) return cc def show (pc,cc ): print ("电脑一的出招为" ,pc) print ("电脑二的出招为" ,cc) if __name__=="__main__" : while (True ): pc=computer_choice() cc=computer_choice() show(pc,cc) win(pc,cc)
image-20220914212607801
改进提升一下:
1 2 3 4 5 6 7 8 9 10 11 12 13 14 15 16 17 18 19 20 21 22 23 24 25 26 27 28 29 30 31 import randomdef win (pc,cc ): if (cc==1 and pc==2 ) or (cc==2 and pc==3 )or (cc==3 and pc==1 ): print ("玩家输" ) elif pc==cc: print ("平" ) else : print ("玩家赢" ) def computer_choice (): cc=random.randint(1 ,3 ) return cc def str (cc ): if cc==1 : return '石头' elif cc==2 : return '剪刀' else : return '布' def show (f,pc,cc ): print ("电脑一的出招为" ,f(pc)) print ("电脑二的出招为" ,f(cc)) if __name__=="__main__" : while (True ): cc=computer_choice() print ("请输入:1.石头 2.剪刀 3.布" ) pc=input () show(str ,pc,cc) win(pc,cc)
image-20220914213324805
2.2 ATM模拟
通过类和对象简单的设计了一个ATM取钱模拟器
1 2 3 4 5 6 7 8 9 10 11 12 13 14 15 16 17 18 19 20 21 22 23 24 25 26 27 28 29 30 31 32 33 34 35 36 37 38 39 40 41 42 43 44 45 46 47 48 49 50 51 52 53 54 55 56 57 58 59 60 61 62 63 64 65 66 67 68 69 70 71 72 73 74 75 import Accountclass ATM (object ): def __init__ (self,money,accounts ): self.money=money self.accounts=accounts @property def money (self ): return self._money; @money.setter def money (self,value ): self._money=value @property def accounts (self ): return self._accounts @accounts.setter def accounts (self,value ): self._accounts=value def searchId (self,id ): for account in self.accounts: if account.id ==id : return account def lode (self ): print ('请输入账号id' ) id = input () account1 = self.searchId(id ) print ('请输入密码' ) password = input () if password == account1.password: print ("欢迎" , account1.name) return account1 def save_money (self ): account=self.lode(); print ("请输入要存入的数目" ) saveMneyValue=input () print ('存款成功' ) account.remain=int (account.remain)+int (saveMneyValue) print ('您的账户余额为' ,account.remain) self.money=self.money+int (saveMneyValue) def withdraw_money (self ): account=self.lode() print ('请输入要取出的数目' ) withdrawMoneyValue=input () if account.remain > withdrawMoneyValue: account.remain=int (account.remain)-int (withdrawMoneyValue) print ('取款成功,您的账户余额为' ,account.remain) else : print ('您的账户余额不足' ) self.money=int (self.money)-int (withdrawMoneyValue) def __str__ (self ): print ("当前ATM中有金额" ,self.money,"元" ) if __name__=="__main__" : accounts=[] for i in range (5 ): name=input () id = input () password=input () remain=input () accounts.append(Account.account(name, id , password, remain)) atm2=ATM(10000 ,accounts) atm2.save_money() atm2.withdraw_money()
1 2 3 4 5 6 7 8 class account (object ): def __init__ (self,name,id ,password,remain ): self.name=name self.remain=remain self.password=password self.id =id __slots__ = ('name' ,'remain' ,'password' ,'id' )
image-20220914214759256
2.3 圣诞树画图
使用Python自带的turtle包,进行圣诞树绘制:
1 2 3 4 5 6 7 8 9 10 11 12 13 14 15 16 17 18 19 20 21 22 23 24 25 26 27 28 29 30 31 32 33 34 35 36 37 38 39 40 41 42 43 44 45 46 47 48 49 50 51 52 53 54 55 56 57 import turtlescreen = turtle.Screen() screen.setup(375 , 700 ) circle = turtle.Turtle() circle.shape('circle' ) circle.color('red' ) circle.speed('fastest' ) circle.up() square = turtle.Turtle() square.shape('square' ) square.color('green' ) square.speed('fastest' ) square.up() circle.goto(0 , 280 ) circle.stamp() k = 0 for i in range (1 , 13 ): y = 30 * i for j in range (i - k): x = 30 * j square.goto(x, -y + 280 ) square.stamp() square.goto(-x, -y + 280 ) square.stamp() if i % 4 == 0 : x = 30 * (j + 1 ) circle.color('red' ) circle.goto(-x, -y + 280 ) circle.stamp() circle.goto(x, -y + 280 ) circle.stamp() k += 3 if i % 4 == 3 : x = 30 * (j + 1 ) circle.color('yellow' ) circle.goto(-x, -y + 280 ) circle.stamp() circle.goto(x, -y + 280 ) circle.stamp() square.color('brown' ) for i in range (13 , 17 ): y = 30 * i for j in range (2 ): x = 30 * j square.goto(x, -y + 280 ) square.stamp() square.goto(-x, -y + 280 ) square.stamp() turtle.mainloop()
image-20220914215352995
3.总结
Python作为一个弱类型语言,是有他的弊端的,在一些需要数据类型转换和严格控制数据类型的情况下,会非常难受。而Python最大的优势在于有大量的库,这些库在特定的编程领域会非常便利。Python本身的语言具有极强的灵活性,而灵活性的言外之意就是规范性很难确定。因此,Python的重点是将第三方包为我所用,在数值计算中发挥他最大的作用。
实验二
PYTHON科学计算库和高维数据导入方法
实验目的
掌握基本的numpy对象及其对应方法
掌握常用的numpy数学函数,学习查找numpy帮助文档
重点学习numpy线性代数方法
掌握matplotlib的绘图对象关系
掌握基本的绘制图形的方法,包括绘制、属性设置、子图
能够通过查阅文档、示例,画出复杂图像
导入mat数据集
实验场地与设备
实验室4074
实验方式
阅读教程与程序设计
实验设计
使用corn数据集进行学习
实验内容
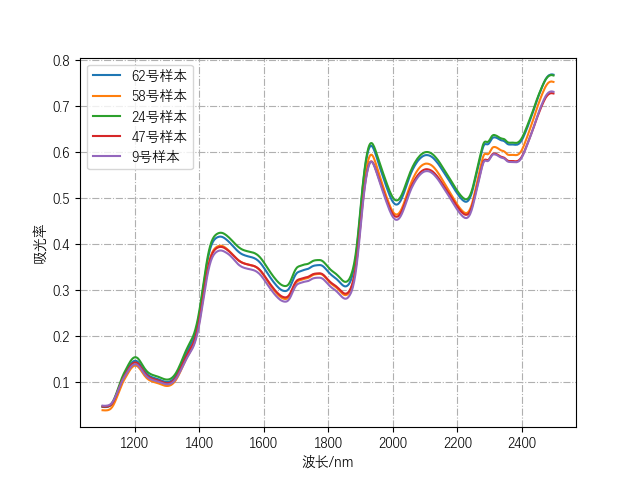
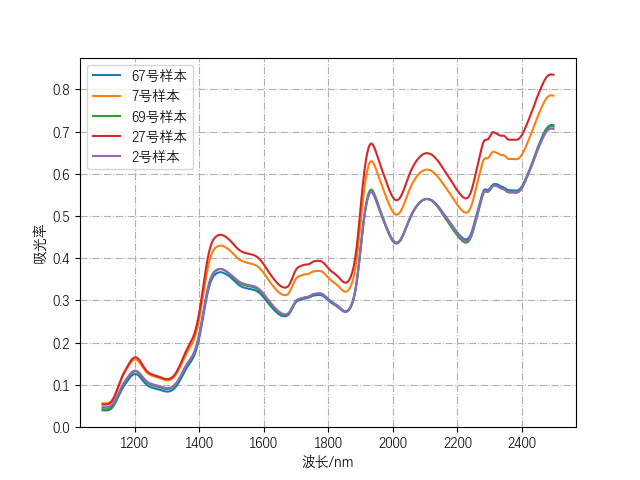
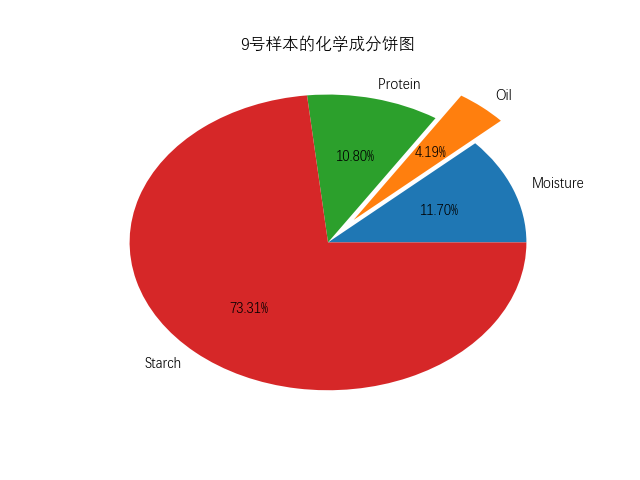
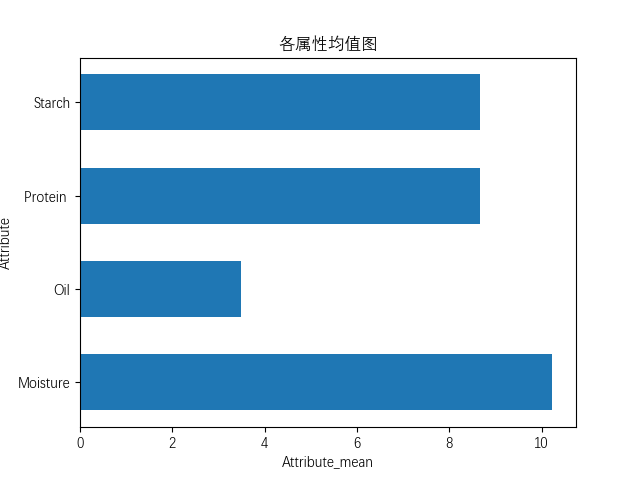
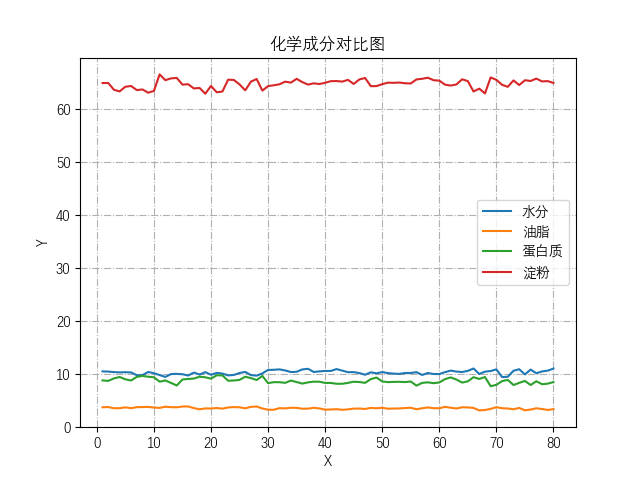
1 2 3 4 5 6 7 8 9 10 11 12 13 14 15 16 17 18 19 20 21 22 23 24 25 26 27 28 29 30 31 32 33 34 35 36 37 38 39 40 41 42 43 44 45 46 47 48 49 50 51 52 53 54 55 56 57 58 59 60 61 62 63 64 65 66 67 68 69 70 71 72 73 74 75 76 77 78 79 80 81 82 83 84 85 86 87 88 89 90 91 92 93 94 95 96 97 98 99 100 101 102 103 104 105 106 107 108 109 110 111 112 113 114 115 116 117 118 119 120 121 122 123 124 125 126 127 128 129 130 131 132 133 134 135 136 137 138 139 140 141 import matplotlibimport scipy.io as sioimport numpy as npimport matplotlib.pyplot as pltdata=sio.loadmat("NIRcorn.mat" ) ''' 首先debug,观察变量信息,发现header、version、global都没有什么实际用处,应该是数据集作者做的标注 通过查找原数据集页面,得知: information:Information about the data,数据说明 以下都是根据NBS的玻璃标准划分的仪器信息 m5nbs:NBS glass stds on m5 mp5nbs:NBS glass stds on mp5 mp6nbs:NBS glass stds on mp6 这些和玉米都没有关系 查阅翻译: cornspect:吸光率数值 cornwavelength:玉米波长 cornprop:玉米的一些属性 propvals:Property values for samples,这个里边有 'Moisture','Oil','Protein ','Starch' 下面这些是从三台不同的仪器上获得的光谱: m5spec:Spectra on instrument m5 mp5spec:Spectra on instrument mp5 mp6spec:Spectra on instrument mp6 观察provals和cornprop的值,我们可以发现,这二者数据一模一样,所以只需要使用conprop即可。 ''' ''' a=data['m5spec'] print(type(a)) print(a) ''' cornwavelength=data["cornwavelength" ] x=[] for i in range (len (cornwavelength)): x.append(cornwavelength[i][0 ]) cornspect = data['cornspect' ] rd=np.random.randint(0 ,80 ,5 ) y1 = [] y2 = [] y3 = [] y4 = [] y5 = [] for i in range (0 , 700 ): y1.append(cornspect[rd[0 ], i]) y2.append(cornspect[rd[1 ], i]) y3.append(cornspect[rd[2 ], i]) y4.append(cornspect[rd[3 ], i]) y5.append(cornspect[rd[4 ], i]) matplotlib.rc("font" ,family='DengXian' ) fig=plt.figure(1 ) plt.plot(x,y1,label=str (rd[0 ])+'号样本' ) plt.plot(x,y2,label=str (rd[1 ])+'号样本' ) plt.plot(x,y3,label=str (rd[2 ])+'号样本' ) plt.plot(x,y4,label=str (rd[3 ])+'号样本' ) plt.plot(x,y5,label=str (rd[4 ])+'号样本' ) plt.legend() plt.grid(linestyle='-.' ) plt.xlabel("波长/nm" ) plt.ylabel("吸光率" ) plt.show() plt.clf() cornprop=data['cornprop' ] Moisture=cornprop[:,0 ] Oil=cornprop[:,1 ] Protein=cornprop[:,2 ] Starch=cornprop[:,3 ] plt.pie(cornprop[rd[4 ],:],labels=['Moisture' ,'Oil' ,'Protein ' ,'Starch' ],explode=(0 , 0.2 , 0 , 0 ),autopct='%.2f%%' ) plt.title(str (rd[4 ])+'号样本的化学成分饼图' ) plt.show() plt.clf() x=np.linspace(1 ,80 ,80 ) plt.plot(x,Moisture,label='水分' ) plt.plot(x,Oil,label='油脂' ) plt.plot(x,Protein,label='蛋白质' ) plt.plot(x,Starch,label='淀粉' ) plt.title('化学成分对比图' ) plt.xlabel('X' ) plt.ylabel('Y' ) plt.legend(loc='right' ) plt.grid(linestyle='-.' ) plt.show() plt.clf() Moisture_ave=np.mean(Moisture) Oil_ave=np.mean(Oil) Protein_ave=np.mean(Protein) Starch_ave=np.mean(Starch) weight=[Moisture_ave,Oil_ave,Protein_ave,Starch_ave] x=np.linspace(0 ,4 ,4 ) plt.barh(x,weight,tick_label=['Moisture' ,'Oil' ,'Protein ' ,'Starch' ]) plt.ylabel('Attribute' ) plt.xlabel('Attribute_mean' ) plt.title('各属性均值图' ) plt.show()
根据样本,可大概观察出1400波长以上透光率相对变化比较明显
各属性对比饼图,属性均值图:
image-20221003002332397
总结
mat数据集中可能存在结构体,通过scipy导入后,会自动将结构体转换为ndarray的结构数组;会将所有属性统一封装成dict,通过k-v取出。
实验三 Python矩阵运算
实验目的
掌握Python中的矩阵运算
尝试使用特征值分解协方差矩阵的方式进行降维
实验场地与设备
实验室4074
实验方式
程序设计
实验设计
实验三
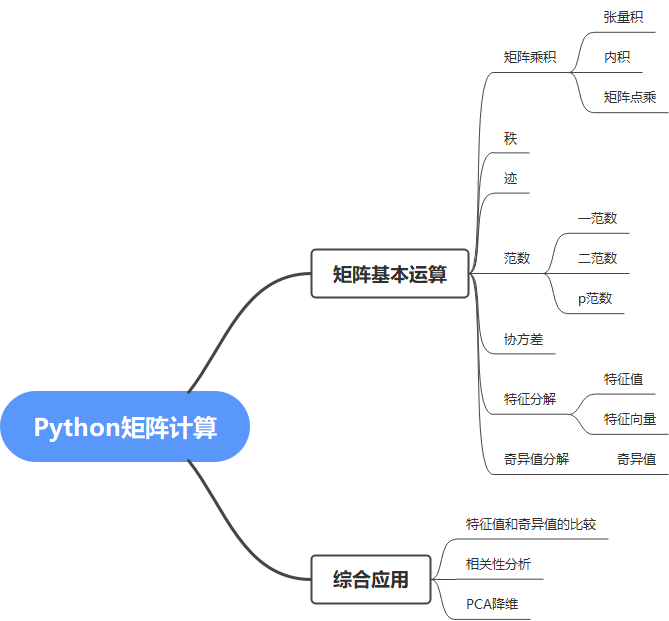
实验内容
矩阵乘积
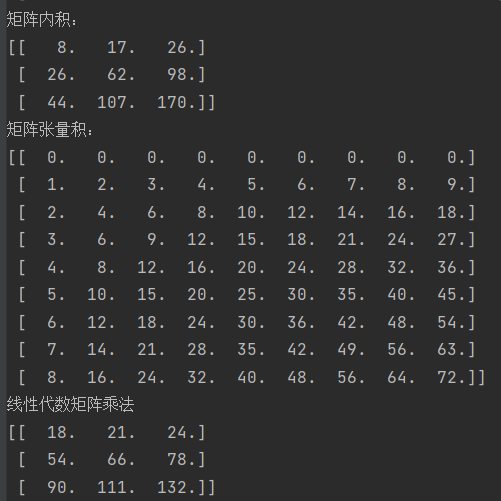
1 2 3 4 5 6 7 8 9 10 11 12 13 14 15 16 17 ''' 基本矩阵运算练习 ''' x=np.linspace(0 ,8 ,9 ).reshape(3 ,3 ) y=np.linspace(1 ,9 ,9 ).reshape(3 ,3 ) innerZ=np.inner(x,y) print ("矩阵内积:" )print (innerZ)outerZ=np.outer(x,y) print ("矩阵张量积:" )print (outerZ)print ("线性代数矩阵乘法" )print (np.dot(x,y))
运行结果:
范数
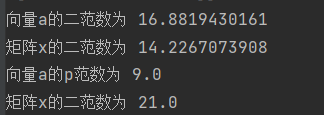
1 2 3 4 5 6 7 8 9 10 11 12 13 14 15 a=np.linspace(0 ,9 ,10 ) a_norm = np.linalg.norm(a,2 ) print ("向量a的二范数为" ,a_norm)x_norm =np.linalg.norm(x,2 ) print ("矩阵x的二范数为" ,x_norm)a_norm = np.linalg.norm(a,np.inf) print ("向量a的p范数为" ,a_norm)x_norm =np.linalg.norm(x,np.inf) print ("矩阵x的二范数为" ,x_norm)
运行结果为:
迹
1 2 3 x_trace = np.trace(x) print ("矩阵x的迹:" ,x_trace)
运行结果为:
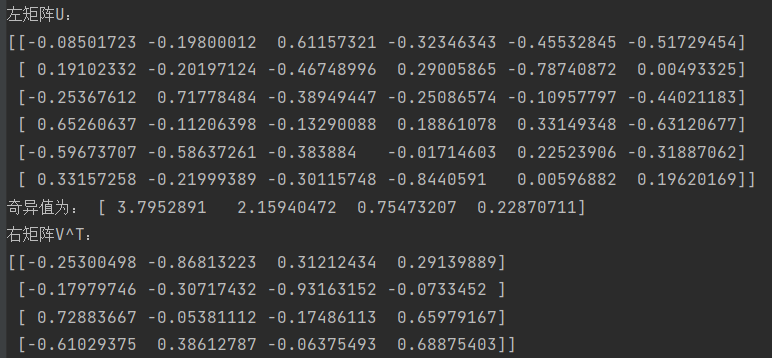
奇异值分解
1 2 3 4 5 6 7 8 9 10 11 12 13 14 15 16 17 18 19 20 21 22 23 24 25 26 27 28 import numpy as npimport scipy.io as sioimport matplotlib.pyplot as pltfrom sklearn.preprocessing import StandardScalerimport seaborn as snsdata=sio.loadmat("NIRcorn.mat" ) cornprop=data['cornprop' ] cornprop=np.array(cornprop) scaler = StandardScaler(copy=True ) cornprop=scaler.fit_transform(cornprop) ran=np.random.randint(0 ,80 ,6 ) cornpropSample1=cornprop[ran][:] print ("随机抽取6个样本结果" )print (cornpropSample1)u1,e1,v1=np.linalg.svd(cornpropSample1) print ("左矩阵U:" )print (u1)print ("奇异值为:" ,e1)print ("右矩阵V^T:" )print (np.transpose(v1))
运行结果为:
特征值和奇异值比较
1 2 3 4 5 6 7 8 9 10 11 12 13 14 15 16 17 18 19 ''' 随机抽取四个样本,对奇异值和特征值进行对比 ''' ran1=np.random.randint(0 ,80 ,4 ) cornpropSample2=cornprop[ran1][:] print ("随机抽取4个样本结果" )print (cornpropSample2)u2,e2,v2=np.linalg.svd(cornpropSample2) print ("奇异值:" ,e2)if np.linalg.matrix_rank(cornpropSample2)==4 : evalue=np.linalg.eigvals(cornpropSample2) print ("特征值:" ,evalue) else : print ("秩为:" ,np.linalg.matrix_rank(cornpropSample2)) print ("为不满秩矩阵,无法进行特征分解" )
运行结果为:
结果表明,不是任何一个方阵都能使得奇异值和特征值,奇异值代表的是最大范围的线性变换程度,特征值代表的线性变换时的方向不变量。
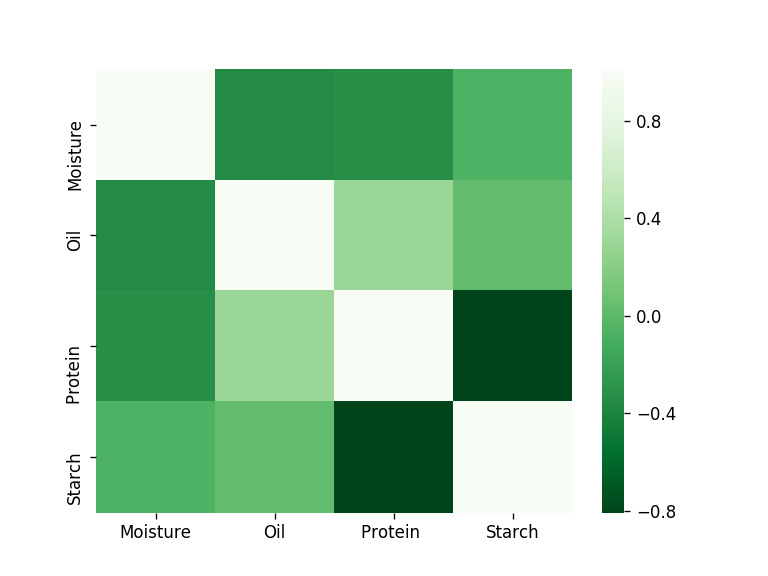
相关性分析
1 2 3 4 5 6 7 8 9 10 11 12 13 14 15 ''' 进行各个化学成分间的相关性分析 ''' cov=np.cov(cornprop.transpose()) print ("协方差矩阵" )print (cov)plt.figure(dpi=120 ) sns.heatmap(data=cov, cmap=plt.get_cmap('Greens_r' ), xticklabels=['Moisture' ,'Oil' ,'Protein ' ,'Starch' ], yticklabels=['Moisture' ,'Oil' ,'Protein ' ,'Starch' ] ) plt.show()
输出结果为:
image-20221016204408714
image-20221016204333850
简单观察,可以看出淀粉和蛋白质的呈现负相关且比较强烈,蛋白质和油脂之间的关系呈现正相关。
PCA的初步尝试
1 2 3 4 5 6 7 8 9 10 11 12 13 14 ''' 协方差可进一步深度挖掘,结合各种矩阵运算进行PCA ''' cov_evalue,cov_vectors = np.linalg.eig(cov) smat = np.zeros((4 , 4 )) smat = np.diag(cov_evalue) plt.figure() p=np.dot(cov_vectors[:2 ,:],cornpropSample2) print ('降维后结果:' )print (p)
输出结果:
image-20221016204707495
总结
本次实验为下一节的PCA进行铺垫,也是绝大部分算法的基础。在学习奇异值分解和特征分解的时候,我通过查阅资料终于找到了解决从特征值到特征矩阵构建的方法,非常有成就感。
实验三 最小二乘法
实验目的
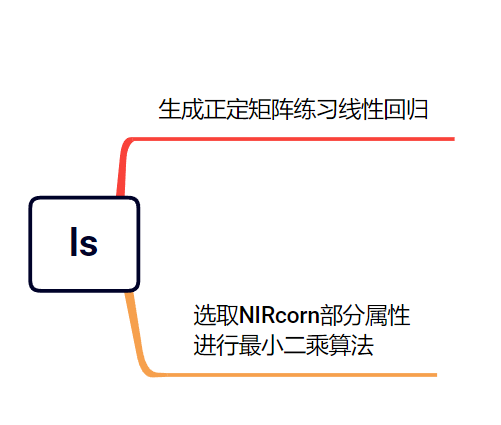
生成正定矩阵联系线性回归
选取部分属性进行最小二乘算法
掌握最小二乘法
实验场地与设备
实验室4074
实验方式
程序设计
实验设计
实验内容
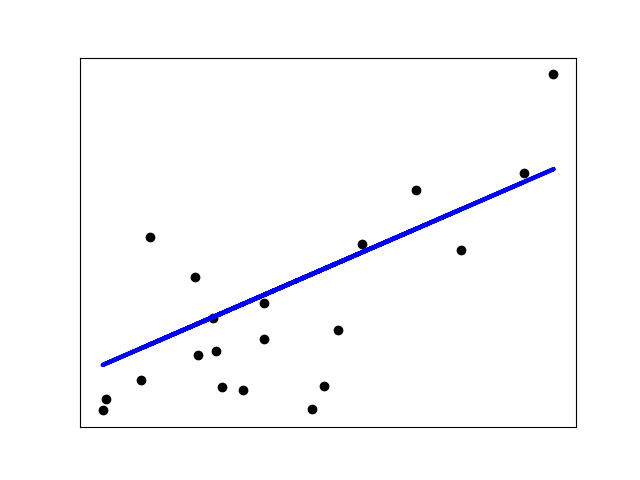
生成正定矩阵使用最小二乘
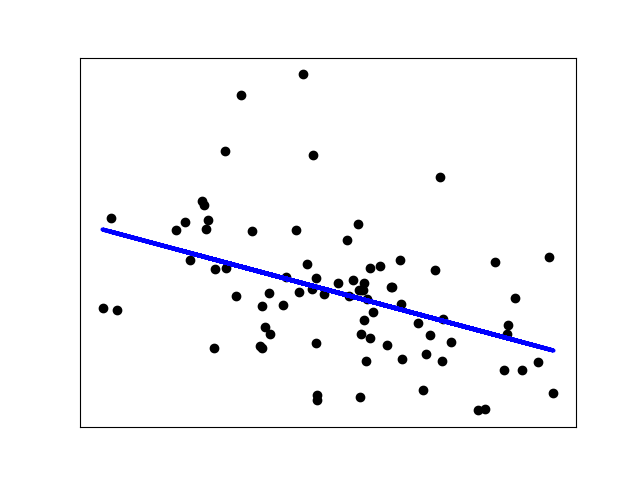
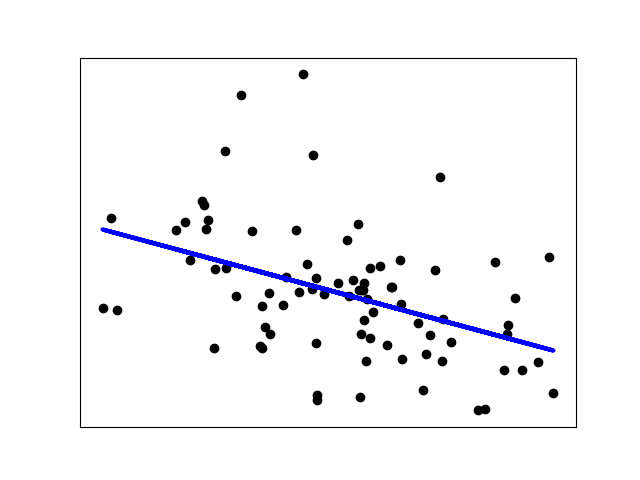
1 2 3 4 5 6 7 8 9 10 11 12 13 14 15 16 17 18 19 20 21 22 23 24 25 26 27 28 29 30 31 32 33 34 35 36 37 38 39 40 41 42 43 44 45 46 47 48 49 50 51 52 53 54 ''' 1.尝试网站代码应用 2.理解源代码 3.回归源码转化伪代码、流程图 ''' import matplotlib.pyplot as pltimport numpy as npfrom sklearn import datasets, linear_modelfrom sklearn.metrics import mean_squared_error, r2_scorediabetes_X, diabetes_y = datasets.load_diabetes(return_X_y=True ) print ("x" ,diabetes_X) print ("y" ,diabetes_y) diabetes_X = diabetes_X[:, np.newaxis, 2 ] diabetes_X_train = diabetes_X[:-20 ] diabetes_X_test = diabetes_X[-20 :] diabetes_y_train = diabetes_y[:-20 ] diabetes_y_test = diabetes_y[-20 :] regr = linear_model.LinearRegression() regr.fit(diabetes_X_train, diabetes_y_train) diabetes_y_pred = regr.predict(diabetes_X_test) ''' 应该是某种误差,具体得看源码 ''' print ("Coefficients: \n" , regr.coef_)print ("Mean squared error: %.2f" % mean_squared_error(diabetes_y_test, diabetes_y_pred))print ("Coefficient of determination: %.2f" % r2_score(diabetes_y_test, diabetes_y_pred))plt.scatter(diabetes_X_test, diabetes_y_test, color="black" ) plt.plot(diabetes_X_test, diabetes_y_pred, color="blue" , linewidth=3 ) plt.xticks(()) plt.yticks(()) plt.show()
image-20230204182023479
image-20230204182051171
image-20230204184117890
选取部分属性进行最小二乘算法
1 2 3 4 5 6 7 8 9 10 11 12 13 14 15 16 17 18 19 20 21 22 23 24 import scipy.io as sioimport numpy as npimport matplotlib.pyplot as pltfrom sklearn import linear_modelfrom sklearn.metrics import mean_squared_error, r2_scoredata=sio.loadmat("../NIRcorn.mat" ) cornprop = data["cornprop" ][:,0 ].reshape(-1 , 1 ) m5spec=data['m5spec' ]['data' ][0 ][0 ][:,0 ] regr = linear_model.LinearRegression() regr.fit(cornprop,m5spec) y_pred = regr.predict(cornprop) plt.scatter(cornprop, m5spec, color="black" ) plt.plot(cornprop, y_pred, color="blue" , linewidth=3 ) plt.xticks(()) plt.yticks(()) plt.show()
image-20230204184257098
总结
最小二乘法作为线性回归的基础,其数学推导十分重要,深刻理解了最小二乘才能初步理解高维空间中的空间变换以及相关的几何意义。
实验四 主成分分析
实验目的
掌握PCA算法原理
用python实现PCA降维
体会python面向对象的灵活
实验场地与设备
实验室4074
实验方式
程序设计
实验设计
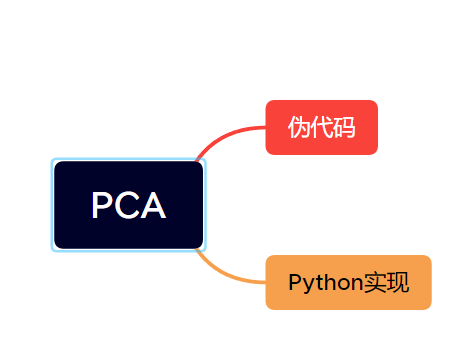
image-20230204185133692
实验内容
伪代码
1 2 3 4 5 6 7 8 input:data,n_components output:U,S ----------------------------------------- Data_mean=np.mean(data) Data=np.substract(data,Data_mean) cov_X=np.cov(np.transpose(Data)) U,S,V=np.linalg.svd(cov_X)
python实现
1 2 3 4 5 6 7 8 9 10 11 12 13 14 15 16 17 18 19 20 21 22 23 24 25 26 27 28 29 30 31 32 33 34 35 36 37 38 39 40 41 42 43 44 45 46 47 48 49 50 51 52 53 54 55 56 57 58 59 60 61 62 63 import numpy as npimport matplotlib.pyplot as pltfrom sklearn import datasetsimport scipy.io as siofrom sklearn.utils.extmath import svd_flipclass PCA (object ): np.set_printoptions(suppress=True ) def __init__ (self,components ): self.components=components def fit (self,X ): X_mean=np.mean(X) X=np.subtract(X,X_mean) cov_X=np.cov(np.transpose(X)) if np.linalg.matrix_rank(cov_X)<np.shape(cov_X)[0 ]: U,S,V=np.linalg.svd(cov_X) U, V = svd_flip(U, V) U=np.array(U[:self.components]).T U *= S[:self.components] explained_variance_ = (S * S.T) / (np.shape(X)[0 ] - 1 ) total_var = explained_variance_.sum () explained_variance_ratio_ = explained_variance_ / total_var self.explained_variance_ratio_ = explained_variance_ratio_[:self.components] return U,S else : eigValue,eigVector=np.linalg.eig(cov_X) index = np.argsort(-eigValue) if self.components > np.shape(X)[1 ]: print ('features is lower than commponents' ) return else : T = np.array(eigVector[index[:self.components]]).T P = np.dot(X,T) explained_variance_ = (eigValue * eigValue.T)/(np.shape(X)[0 ]-1 ) total_var = explained_variance_.sum () explained_variance_ratio_ = explained_variance_ / total_var self.explained_variance_ratio_=explained_variance_ratio_[:self.components] return P,T if __name__ == '__main__' : data = sio.loadmat("../NIRcorn.mat" ) cornprop = data["cornprop" ] m5spec = data['m5spec' ]['data' ][0 ][0 ] y = data['cornprop' ][:, [0 ]] x = m5spec pca=PCA(2 ) U,S=pca.fit(x) print ( "explained variance ratio (first two components): %s" % str (pca.explained_variance_ratio_) )
explained variance ratio (first two components): [0.99994001
0.00005929]
调用PCA降维鸢尾花
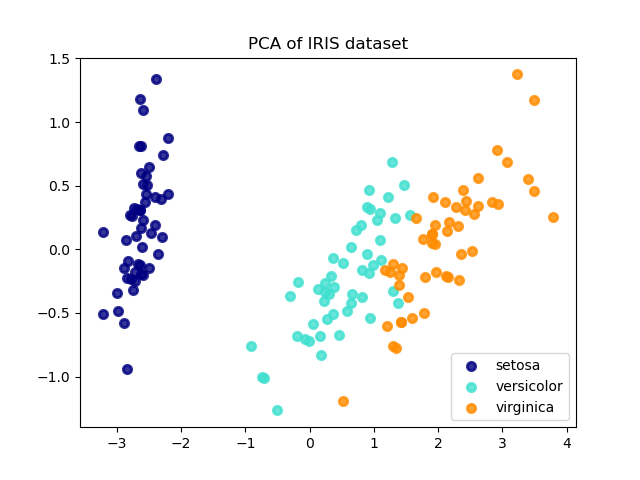
1 2 3 4 5 6 7 8 9 10 11 12 13 14 15 16 17 18 19 20 21 22 23 24 25 26 27 28 29 30 31 32 33 import matplotlib.pyplot as pltimport numpy as npfrom sklearn import datasetsfrom sklearn.decomposition import PCAiris = datasets.load_iris() X = iris.data y = iris.target target_names = iris.target_names pca = PCA(n_components=2 ) X_r = pca.fit(X).transform(X) print ( "explained variance ratio (first two components): %s" % str (pca.explained_variance_ratio_) ) plt.figure() colors = ["navy" , "turquoise" , "darkorange" ] lw = 2 for color, i, target_name in zip (colors, [0 , 1 , 2 ], target_names): plt.scatter( X_r[y == i, 0 ], X_r[y == i, 1 ], color=color, alpha=0.8 , lw=lw, label=target_name ) plt.legend(loc="best" , shadow=False , scatterpoints=1 ) plt.title("PCA of IRIS dataset" ) plt.show()
image-20230204185710362
调用pca降维NIRcorn
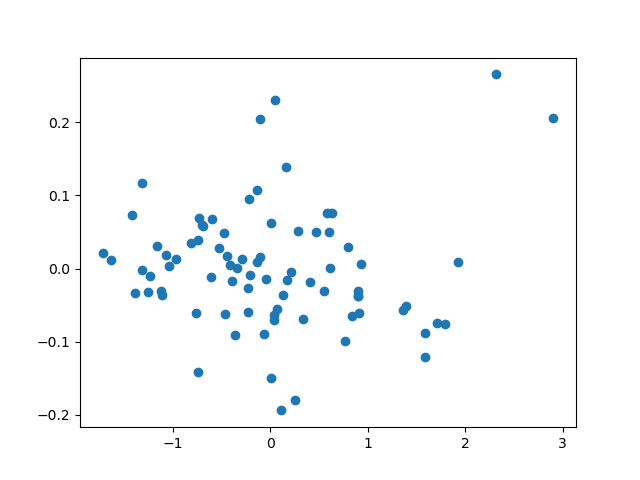
1 2 3 4 5 6 7 8 9 10 11 12 13 14 15 16 17 18 19 20 21 22 23 import scipy.io as sioimport numpy as npimport matplotlib.pyplot as pltfrom sklearn.decomposition import PCAdata=sio.loadmat("../NIRcorn.mat" ) cornprop = data["cornprop" ] m5spec=data['m5spec' ]['data' ][0 ][0 ] pca = PCA(n_components=2 ) x = pca.fit(m5spec).transform(m5spec) print ( "explained variance ratio (first two components): %s" % str (pca.explained_variance_ratio_) ) plt.scatter(x[:,0 ],x[:,1 ]) plt.show()
总结
主成分分析是基于投影的方法,而衡量投影距离的就是协方差矩阵。而对于协方差矩阵的分解方式就显得尤为重要,我自己实现的PCA与sklearn种出现显著差异的原因就是在奇异值分解的方式。sklearn采用的是随机奇异值分解。
实验五 主成分回归
实验目的
掌握PCR算法原理
掌握交叉验证算法应用;
体会python面向对象的灵活
实验场地与设备
实验室4074
实验方式
程序设计
实验设计
实验内容
伪代码
1 2 3 4 5 6 7 8 PCR.fit ----------------------------- input:X,y,n_components output:P,b ------------------------------ P = PCA(X,n_components) T = X*P b = LS.fit(T,y)
1 2 3 4 5 6 7 PCR.predict ----------------------------- input:X,P,b output:y_predict ----------------------------- T = X*P y_predict = T*b
1 2 3 4 5 6 7 8 9 10 11 12 13 14 PCR.cv ----------------------------- input:X,y,max_pcs,k output:best_pcs -----------------------------X_train,X_val,y_train,y_val = cross validation.split(X,y,k) for n_pcs in range(2 ,max_pcs+1 ): y_predict = [ ] for i in range(0 ,k): P,b = PCR.fit(X_train=X_k≠i,y_train=y_k≠i,n_pcs) ypre = PCR.predict(X_val=X_k=i,P,b) y_predict.append(ypre) RMSE(y,y_predict,len(y)) best_pcs = RMSE.index (min(RMSE)) return best_pcs
Python实现 1 2 3 4 5 6 7 8 9 10 11 12 13 14 15 16 17 18 19 20 21 22 23 24 25 26 import numpy as npfrom sklearn import cross_validationclass Cross_Validation (): def __init__ (self, x, y, n_folds, max_components ): self.x = x self.y = y self.n_folds = n_folds self.max_components = max_components self.n = x.shape[0 ] def CV (self ): kf = cross_validation.KFold(self.n, self.n_folds) x_train=[] x_test=[] y_train=[] y_test=[] for train_index,test_index in kf: xtr, xte = self.x[train_index], self.x[test_index] ytr, yte = self.y[train_index], self.y[test_index] x_train.append(xtr) x_test.append(xte) y_train.append(ytr) y_test.append(yte) return x_train, x_test, y_train, y_test
1 2 3 4 5 6 7 8 9 10 11 12 13 14 15 16 17 18 19 20 21 22 23 24 25 26 27 28 29 30 31 32 33 34 35 36 37 38 39 40 41 42 43 44 45 46 47 48 49 50 51 52 53 54 55 56 57 58 59 60 61 62 63 64 65 66 67 68 69 70 71 72 73 74 75 76 77 78 79 80 81 82 83 84 85 86 87 88 89 import numpy as npimport matplotlib.pyplot as pltfrom sklearn.decomposition import PCAimport scipy.io as siofrom Cross_Validation import Cross_Validationclass PCR (): def __init__ (self, max_components ): self.max_components=max_components def fit (self,X,y,best_components ): self.x_mean = np.mean(X, axis=0 ) self.y_mean = np.mean(y, axis=0 ) pca=PCA(n_components=best_components) pca=pca.fit(X) X_r=pca.transform(X) b=np.linalg.lstsq(X_r,np.subtract(y,self.y_mean))[0 ] return b,pca def pridict (self,b,X,pca ): T=pca.transform(X) y_pre = np.dot(T, b) y_predict = np.add(y_pre, self.y_mean) return y_predict def cv_pridict (self,X,y,n_fold, ): cv = Cross_Validation(X,y,n_fold,self.max_components) X_train, X_test, y_train, y_test = cv.CV() y_allPredict=np.ones((1 ,self.max_components)) for i in range (n_fold): y_predict=np.zeros((y_test[i].shape[0 ],self.max_components)) for j in range (self.max_components): b,pca=self.fit(X_train[i],y_train[i],j+1 ) y_pre=self.pridict(b,X_test[i],pca) y_predict[:,j]=y_pre.ravel() y_allPredict=np.vstack((y_allPredict,y_predict)) y_allPredict=y_allPredict[1 :] return y_allPredict,cv def RMSE_CV (self,y_allPredict, y_measure,cv ): press = np.square(np.subtract(y_allPredict, y_measure)) press_all = np.sum (press, axis=0 ) RMSECV = np.sqrt(press_all / cv.n) min_RMSECV = min (RMSECV) comp_array = RMSECV.argsort() comp_best = comp_array[0 ] + 1 return RMSECV, min_RMSECV, comp_best def show_Select_comp (self,RMSECV ): x=np.linspace(1 ,20 ,20 ) plt.figure() plt.plot(x,RMSECV) plt.ylabel(RMSECV) plt.xlabel('n_comp' ) plt.show() if __name__=='__main__' : data = sio.loadmat("../NIRcorn.mat" ) cornprop = data["cornprop" ] m5spec = data['m5spec' ]['data' ][0 ][0 ] y = data['cornprop' ][:, [0 ]] x=m5spec y_mean=np.mean(y,axis=0 ) pcr=PCR(20 ) b,pca=pcr.fit(x,y,14 ) y_pre=pcr.pridict(b,x,pca) print (y) print (y_pre) ''' # 预测图显示 plt.figure() plt.scatter(np.linspace(1,80,80),y_pre) plt.scatter(np.linspace(1, 80, 80),y) plt.show() ''' y_pre,cv=pcr.cv_pridict(x,y,10 ) print (y_pre) RMSEcv,min_RMSEcv,best_comp=pcr.RMSE_CV(y_pre,cv.y,cv) print (RMSEcv) pcr.show_Select_comp(RMSEcv)
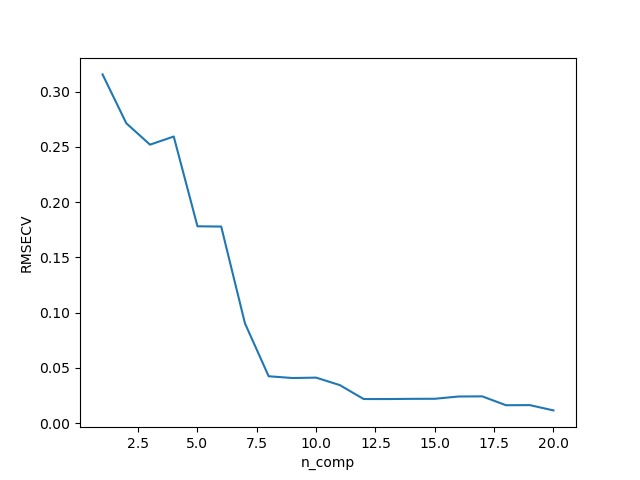
参数选择:
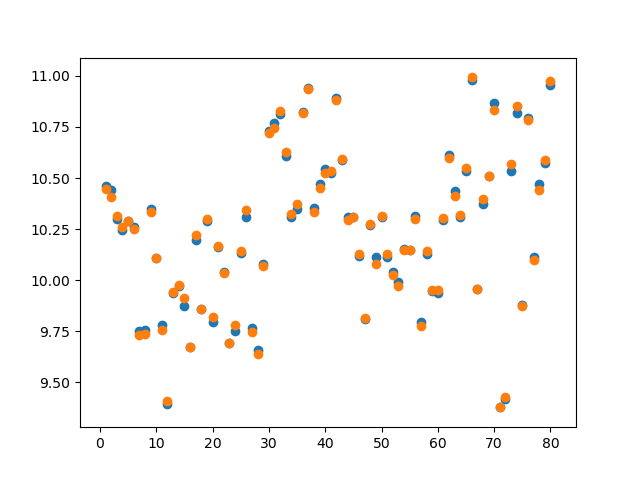
预测结果:
image-20230204192338375
总结
主成分回归分析(PCR),以主成分为自变量进行的回归分析。是分析多元共线性问题的一种方法,当自变量存在复共线性刚,用于改进最小二乘回归的统计分析方法。霍特林1933年首先用主成分分析相关结构,1965年马西提出主成分回归。
基本步骤:
(1)将自变量转换为标准分;
(2)求出这此标准分的主成分,去掉特征根很小的主成分;
(3)用最小二乘法作因变量对保留的主成分的回归;
(4)将回归方程中的主成分换成标准分的线性组合,得到由标准分给出的回归方程
在实现过程中,注意到一点,self在python面向对象的活用,可以大幅度减少变量定义,而且可以作为全局变量跳出循环中,非常好用。
实验六 偏最小二乘算法
实验目的
实现NIPALS算法并对nircorn数据集进行预测
掌握交叉验证算法应用;
实现PLS算法
实验场地与设备
实验室4074
实验方式
程序设计
实验设计
实验内容
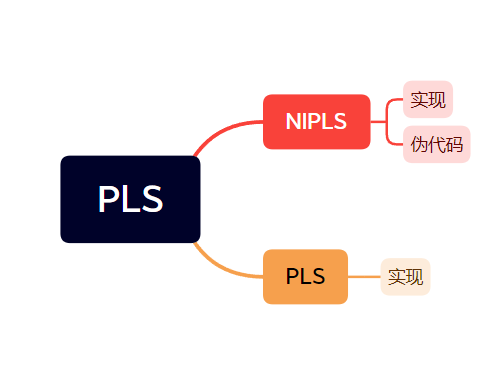
NIPLS伪代码
1 2 3 4 5 6 7 8 9 10 11 12 13 14 15 16 17 18 19 20 21 22 23 24 25 26 27 28 29 30 31 32 NIPALS.py -------------------------------------------- input: X,Y,n_comp output:P,Q,T,U,W,C -------------------------------------------- for i in range(n_comp): u_new=Y[i+1 ] u_old=np.ones((Y.shape[i+1 ],1 )) while || u_new-u_old ||>=0.0001 (极小值): u_old=u_new w = X^T * u_new / ( u_old^T * u_old ) w = w / sqrt(w^T * w) t = X * w c = Y * t /( t^T * t ) c = c / sqrt(c^T * c) u_new = Y * c p = X * t / ( t^T * t ) q = Y * c / ( c^T * c ) X1 = X - t * p^T b1 = u_new^T * t / ( t^T * t ) Y1 = Y - b * t * q^T B[n_comp,:]=b P[:,n_comp]=p Q[:,n_comp]=q T[:,n_comp]=t U[:,n_comp]=u_new W[:,n_comp]=w C[:,n_comp]=c --------------------------------------------
NIPLS实现
1 2 3 4 5 6 7 8 9 10 11 12 13 14 15 16 17 18 19 20 21 22 23 24 25 26 27 28 29 30 31 32 33 34 35 36 37 38 39 40 41 42 43 44 45 46 47 48 49 50 51 52 53 54 55 56 57 58 59 60 61 62 63 64 65 66 67 68 69 70 71 72 73 74 75 76 77 78 79 80 81 82 83 84 85 86 87 88 89 90 91 92 93 94 95 96 97 98 99 100 101 102 import numpy as npfrom numpy import linalgimport scipy.io as siofrom sklearn.model_selection import train_test_splitimport matplotlib.pyplot as pltclass NIPALS (object ): def __init__ (self, max_pcs, sigma=0.0001 ): self.max_pcs = max_pcs self.sigma = sigma def fit (self, X, Y ): E, F = X, Y P = np.mat(np.ones((X.shape[1 ], self.max_pcs))) T = np.mat(np.ones((X.shape[0 ], self.max_pcs))) W = np.mat(np.ones((X.shape[1 ], self.max_pcs))) Q = np.mat(np.ones((Y.shape[1 ], self.max_pcs))) U = np.mat(np.ones((X.shape[0 ], self.max_pcs))) C = np.mat(np.ones((Y.shape[1 ], self.max_pcs))) B = np.ones((self.max_pcs, X.shape[1 ], Y.shape[1 ])) for pcs in range (0 , self.max_pcs): t_old, t_new = np.zeros((X.shape[0 ], 1 )), np.ones((X.shape[0 ], 1 )) p_old, p_new = np.ones((X.shape[1 ], 1 )), np.ones((X.shape[1 ], 1 )) w_old, w_new = np.ones((X.shape[1 ], 1 )), np.ones((X.shape[1 ], 1 )) q_old, q_new = np.ones((Y.shape[1 ], 1 )), np.ones((Y.shape[1 ], 1 )) u_old, u_new = np.mat(Y[:, 0 ]).T, np.ones((X.shape[0 ], 1 )) while (np.sqrt(np.sum (np.square(np.subtract(t_new, t_old)) / t_new.shape[0 ])) > self.sigma): t_old = t_new w_old = (np.dot(u_old.T, X) / np.dot(u_old.T, u_old)).T w_new = (w_old.T / np.sqrt(np.dot(w_old.T, w_old))).T t_new = np.dot(X, w_new) / np.dot(w_new.T, w_new) q_old = (np.dot(t_new.T, Y) / np.dot(t_new.T, t_new)).T q_new = (q_old.T / np.linalg.norm(q_old.T)).T u_new = np.dot(Y, q_new) / np.dot(q_new.T, q_new) if (Y.shape[1 ] == 1 ): p_old = (np.dot(t_new.T, X) / np.dot(t_new.T, t_new)).T p_new = (p_old.T / np.linalg.norm(p_old.T)).T t_new = t_old * np.linalg.norm(p_old.T) w_new = (w_old.T * np.linalg.norm(p_old.T)).T b = np.dot(np.dot(w_new, linalg.inv(np.dot(p_new.T, w_new))), q_new.T) P[:, pcs] = p_new T[:, pcs] = t_new W[:, pcs] = w_new B[pcs, ::] = b Q[:, pcs] = q_new U[:, pcs] = u_new E = E - np.dot(t_new, p_new.T) F = F - np.dot(t_new, q_new.T) self.X = E self.Y = F return P, T, W, Q, U, B def predict (self, X, B, best_pcs ): B_new = np.zeros((B[0 ].shape[0 ], B[0 ].shape[1 ])) B_new[:] = B[best_pcs - 1 ] Y_predict = np.dot(X, B_new) return Y_predict def RMSE (y, y_predict, k ): press = np.square(np.subtract(y, y_predict)) press_all = np.sum (press, axis=0 ) RMSE = np.sqrt(press_all / k) return RMSE if __name__ == '__main__' : data = sio.loadmat("../NIRcorn.mat" ) cornprop = data["cornprop" ] Y = cornprop print (np.shape(Y)) A = data["m5spec" ] m5spec = A["data" ][0 ][0 ] X_train, X_test, y_train, y_test = train_test_split(m5spec, Y, test_size=0.2 , random_state=0 ) print ("X_train:" , X_train.shape) print ("X_test:" , X_test.shape) print ("y_train:" , y_train.shape) print ("y_test:" , y_test.shape) X_mean = np.mean(X_train, axis=0 ) X_center = np.subtract(X_train, X_mean) Y_mean = np.mean(y_train, axis=0 ) Y_center = np.subtract(y_train, Y_mean) X_test_mean = np.mean(X_test, axis=0 ) X_test_center = np.subtract(X_test, X_test_mean) pls = NIPALS(5 ) P, T, W, Q, U, B = pls.fit(X_center, Y_center) Y_predict = pls.predict(X_test_center, B, 2 ) Ypre = Y_predict + Y_mean rmse = RMSE(y_test.ravel(), Ypre.ravel(), Y_center.shape[0 ]) print ("Y_predict:" , Ypre) print ("rmse:" , rmse)
rmse: 0.5119355259810657
PLS实现
1 2 3 4 5 6 7 8 9 10 11 12 13 14 15 16 17 18 19 20 21 22 23 24 25 26 27 28 29 30 31 32 33 34 35 36 37 38 39 40 41 42 43 44 45 46 47 48 49 50 51 52 53 54 55 56 57 58 59 60 61 62 63 64 65 66 67 68 69 70 71 72 73 74 75 76 77 78 79 80 81 82 83 84 85 86 87 88 89 90 91 92 93 94 95 96 97 98 99 100 101 102 103 104 105 106 from sklearn.cross_decomposition import PLSRegressionimport numpy as npfrom Cross_Validation import Cross_Validationimport scipy.io as sioimport matplotlib.pyplot as pltclass pls (): def __init__ (self,max_comp ): self.max_comp=max_comp def fit (self,X,Y,n_comp ): pls=PLSRegression(n_components=n_comp) pls.fit(X,Y) return pls def predict (self,X,pls ): return pls.predict(X) def cv_predict (self,X,y,n_fold ): cv = Cross_Validation(X, y, n_fold, self.max_comp) X_train, X_test, y_train, y_test = cv.CV() y_allPredict = np.ones((1 , self.max_comp)) for i in range (n_fold): y_predict = np.zeros((y_test[i].shape[0 ], self.max_comp)) for j in range (self.max_comp): pls=self.fit(X_train[i],y_train[i],j+1 ) y_pre=self.predict(X_test[i],pls) y_predict[:,j]=y_pre.ravel() y_allPredict = np.vstack((y_allPredict, y_predict)) y_allPredict = y_allPredict[1 :] return y_allPredict, cv,y_test,y_train,X_test,X_train def RMSE_CV (self, y_allPredict, y_measure, cv ): press = np.square(np.subtract(y_allPredict, y_measure)) press_all = np.sum (press, axis=0 ) RMSECV = np.sqrt(press_all / cv.n) min_RMSECV = min (RMSECV) comp_array = RMSECV.argsort() comp_best = comp_array[0 ] + 1 return RMSECV, min_RMSECV, comp_best def show_Select_comp (self,RMSECV ): x=np.linspace(1 ,20 ,20 ) plt.figure() plt.plot(x,RMSECV,marker='^' ,markersize=10 ,markerfacecolor='orange' ,color='black' ) plt.xlabel('num_components' ) plt.ylabel('RMSECV' ) plt.show() def show_predict (self,y ): plt.figure() plt.plot([min (y), max (y)], [min (y), max (y)], label='y=x' , color='black' ) plt.scatter(y, y_pre, color='red' , label='y_all' ) plt.xlabel('measure value' ) plt.ylabel('predict value' ) plt.legend() plt.show() def show_predict (self,y,y_pre ): plt.figure() plt.plot([min (y), max (y)], [min (y), max (y)], label='y=x' , color='black' ) plt.scatter(y, y_pre, color='red' , label='y_all' ) plt.xlabel('measure value' ) plt.ylabel('predict value' ) plt.legend() plt.show() def show_cv_predict (self,y,x_test,y_test,y_train,x_train,pls ): plt.figure() plt.plot([min (y), max (y)], [min (y), max (y)], label='y=x' , color='black' ) plt.scatter(y_test[0 ],self.predict(x_test[0 ],pls), color='red' , label='test set' ) plt.scatter(y_train[0 ],self.predict(x_train[0 ],pls), color='blue' , label='train set' ) plt.xlabel('measure value' ) plt.ylabel('predict value' ) plt.legend() plt.show() if __name__=='__main__' : data = sio.loadmat("../NIRcorn.mat" ) cornprop = data["cornprop" ] m5spec = data['m5spec' ]['data' ][0 ][0 ] y = data['cornprop' ][:, [0 ]] x=m5spec pls=pls(20 ) pls1=pls.fit(x,y,14 ) y_pre=pls.predict(x,pls1) print (y) print (y_pre) plt.figure() plt.plot([min (y), max (y)],[min (y), max (y)],label='y=x' ,color='black' ) plt.scatter(y, y_pre,color='red' ,label='y_all' ) plt.xlabel('measure value' ) plt.ylabel('predict value' ) plt.legend() plt.show() y_pre, cv,y_test,y_train,x_test,x_train = pls.cv_predict(x, y, 10 ) print (y_pre) RMSEcv, min_RMSEcv, best_comp = pls.RMSE_CV(y_pre, cv.y, cv) print (RMSEcv) pls.show_Select_comp(RMSEcv) pls.show_cv_predict(y,x_test,y_test,y_train,x_train,pls1)
1 2 3 4 5 6 7 8 9 10 11 12 13 14 15 16 17 18 19 20 21 22 23 24 25 26 import numpy as npfrom sklearn import cross_validationclass Cross_Validation (): def __init__ (self, x, y, n_folds, max_components ): self.x = x self.y = y self.n_folds = n_folds self.max_components = max_components self.n = x.shape[0 ] def CV (self ): kf = cross_validation.KFold(self.n, self.n_folds) x_train=[] x_test=[] y_train=[] y_test=[] for train_index,test_index in kf: xtr, xte = self.x[train_index], self.x[test_index] ytr, yte = self.y[train_index], self.y[test_index] x_train.append(xtr) x_test.append(xte) y_train.append(ytr) y_test.append(yte) return x_train, x_test, y_train, y_test
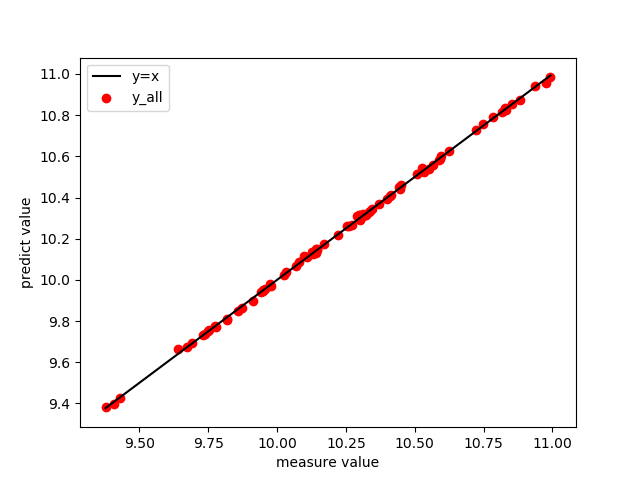
预测结果:
image-20230204193337549
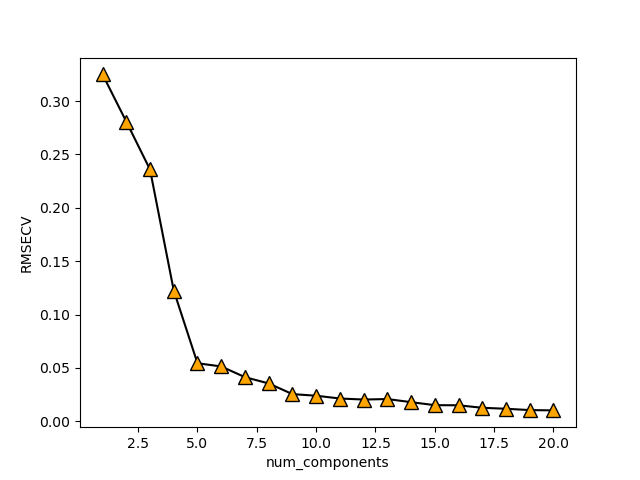
参数选择:
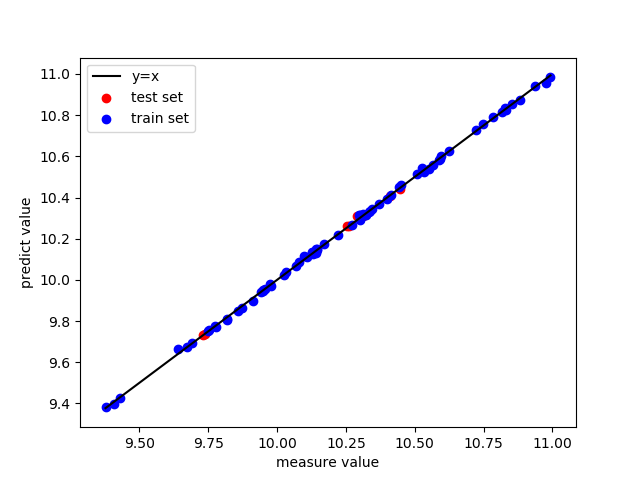
拟合效果:
image-20230204193435252
总结
PLS的代码实现总体上和PCR类似,其核心区别就在于PLS的fit和predict函数发生了改变,
实验七 岭回归
实验目的
实现RR算法
掌握交叉验证算法应用;
观察岭脊
实验场地与设备
实验室4074
实验方式
程序设计
实验设计
实验内容
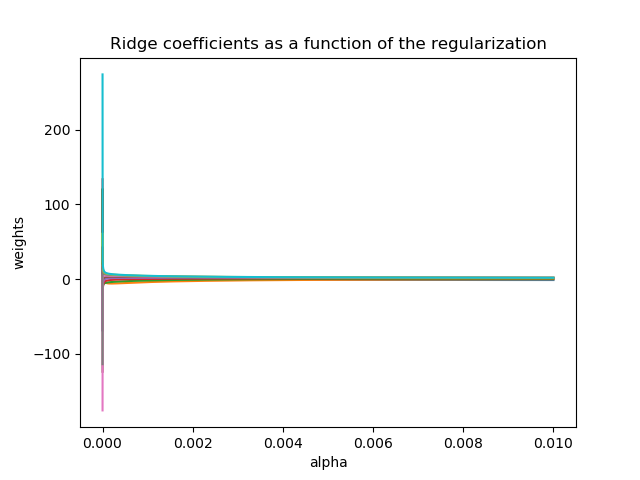
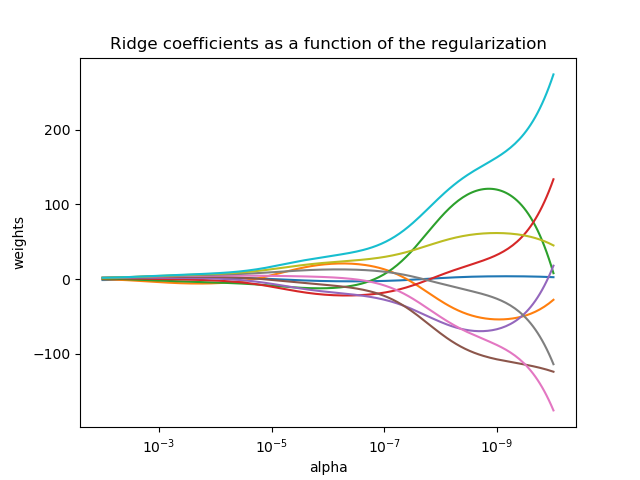
岭迹
1 2 3 4 5 6 7 8 9 10 11 12 13 14 15 16 17 18 19 20 21 22 23 24 25 26 27 28 import numpy as npimport matplotlib.pyplot as pltfrom sklearn import linear_modelX = 1.0 / (np.arange(1 , 11 ) + np.arange(0 , 10 )[:, np.newaxis]) y = np.ones(10 ) n_alphas = 200 alphas = np.logspace(-10 , -2 , n_alphas) coefs = [] for a in alphas: ridge = linear_model.Ridge(alpha=a, fit_intercept=False ) ridge.fit(X, y) coefs.append(ridge.coef_) print (alphas)ax = plt.gca() ax.plot(alphas, coefs) plt.xlabel("alpha" ) plt.ylabel("weights" ) plt.title("Ridge coefficients as a function of the regularization" ) plt.axis("tight" ) plt.show()
算术坐标尺度
对数坐标尺度
RR实现
1 2 3 4 5 6 7 8 9 10 11 12 13 14 15 16 17 18 19 20 21 22 23 24 25 26 27 28 29 30 31 32 33 34 35 36 37 38 39 40 41 42 43 44 45 46 47 48 49 50 51 52 53 54 55 56 57 58 59 60 61 62 63 64 65 66 67 68 69 70 71 72 73 74 75 76 77 78 79 80 81 82 83 84 85 86 87 88 89 90 91 92 import numpy as npimport matplotlib.pyplot as pltimport scipy.io as siofrom sklearn.linear_model import Ridgefrom Cross_Validation import Cross_Validationclass RidgeRegression (): def __init__ (self,n_lambda ): self.n_lambda=n_lambda def fit (self,X,y,best_lambda ): c=np.dot(X.T,X) I=np.eye(np.shape(c)[0 ]) d=np.dot(best_lambda,I) e=(c+d) e=np.linalg.inv(e) b = np.dot(X.T, y) b=np.dot(e,b) self.b=b return b def pridict (self,x ): y_pri=np.dot(x,self.b) return y_pri def cv_pridict (self,X,y,n_fold ): cv = Cross_Validation(X, y, n_fold, self.n_lambda) X_train, X_test, y_train, y_test = cv.CV() y_allPredict = np.ones((1 , self.n_lambda)) lambda1=np.logspace(-10 ,-2 ,self.n_lambda) for i in range (n_fold): y_predict = np.zeros((y_test[i].shape[0 ], self.n_lambda)) k=0 for j in np.nditer(lambda1) : print ('第' ,k+1 +self.n_lambda*i,'次:' ,j) pls = self.fit(X_train[i], y_train[i], j) y_pre = self.pridict(X_test[i]) y_predict[:, k] = y_pre.ravel() k=k+1 y_allPredict = np.vstack((y_allPredict, y_predict)) y_allPredict = y_allPredict[1 :] return y_allPredict, cv, y_test, y_train, X_test, X_train def RMSE_CV (self, y_allPredict, y_measure, cv ): press = np.square(np.subtract(y_allPredict, y_measure)) press_all = np.sum (press, axis=0 ) RMSECV = np.sqrt(press_all / cv.n) lambda_best= min (RMSECV) return RMSECV, lambda_best def show_Select_lambda (self,RMSECV ): x=np.logspace(-10 ,-2 ,self.n_lambda) plt.figure() plt.plot(x,RMSECV,marker='^' ,markersize=10 ,markerfacecolor='orange' ,color='black' ) plt.xlabel('lambda' ) plt.ylabel('RMSECV' ) ax = plt.gca() ax.set_xscale("log" ) ax.set_xlim(ax.get_xlim()[::-1 ]) plt.show() def show_cv_predict (self, y, x_test, y_test, y_train, x_train ): plt.figure() plt.plot([min (y), max (y)], [min (y), max (y)], label='y=x' , color='black' ) plt.scatter(y_test[0 ], self.pridict(x_test[0 ]), color='red' , label='test set' ) plt.scatter(y_train[0 ], self.pridict(x_train[0 ]), color='blue' , label='train set' ) plt.xlabel('measure value' ) plt.ylabel('predict value' ) plt.legend() plt.show() if __name__ =='__main__' : data = sio.loadmat("../NIRcorn.mat" ) cornprop = data["cornprop" ] m5spec = data['m5spec' ]['data' ][0 ][0 ] y = data['cornprop' ][:, [0 ]] x = m5spec rr=RidgeRegression(50 ) rr.fit(x,y,0.335641904424 ) y_pri=rr.pridict(x) y_allPredict, cv, y_test, y_train, X_test, X_train=rr.cv_pridict(x,y,20 ) RMSECV, best_lambda =rr.RMSE_CV(y_allPredict,cv.y,cv) rr.show_Select_lambda(RMSECV) print (best_lambda) rr.show_cv_predict(y, X_test, y_test, y_train, X_train) print (y_train[0 ]) print (rr.pridict(X_train[0 ]))
1 2 3 4 5 6 7 8 9 10 11 12 13 14 15 16 17 18 19 20 21 22 23 24 25 import numpy as npfrom sklearn import cross_validationclass Cross_Validation (): def __init__ (self, x, y, n_folds, max_lambda ): self.x = x self.y = y self.n_folds = n_folds self.n = x.shape[0 ] def CV (self ): kf = cross_validation.KFold(self.n, self.n_folds) x_train=[] x_test=[] y_train=[] y_test=[] for train_index,test_index in kf: xtr, xte = self.x[train_index], self.x[test_index] ytr, yte = self.y[train_index], self.y[test_index] x_train.append(xtr) x_test.append(xte) y_train.append(ytr) y_test.append(yte) return x_train, x_test, y_train, y_test
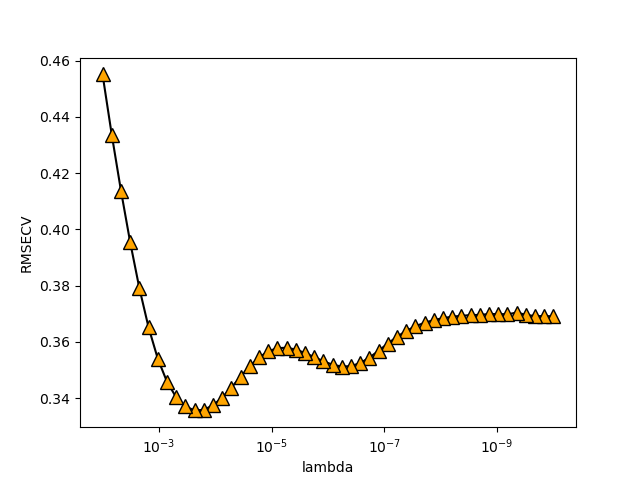
正则化参数选择图像
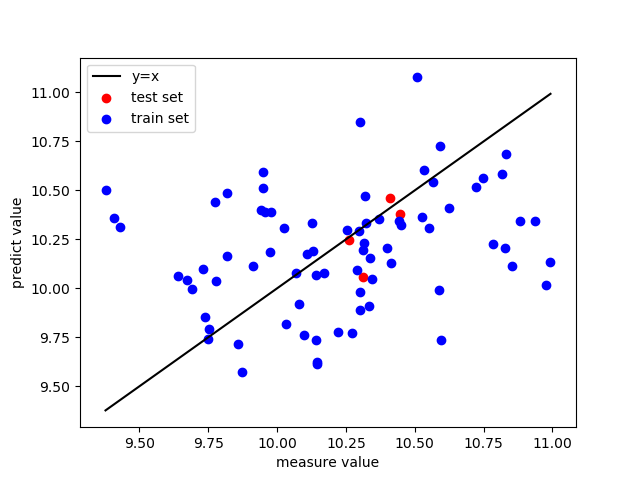
拟合效果图像
image-20230204194101069
可以发现最后回归系数都分布在10左右,比较平均,有很强的抗扰动。
总结
岭回归对于模型的特征控制有着很好的效果,形成的回归系数相对平均有很强的抗干扰左右,而且能解决多重共线性,解决布满秩的情况。有很强的应用价值。


