作业九 反向传播算法(BP)

算法推导

神经网络

令input layer 到hidden layer的权重为\(w_{ih}\),hidden layer和output layer的权重为\(w_{ho}\)

前向算法伪代码:

Algorithm1: forward
input: X
output: \(y\)
1. hidden_in=\(w_{ih}X+b_1\)
2. hidden_out=\(\sigma(hidden\_in)\)
3. output_in=\(w_{ho}X+b_2\)
4. output_out=\(\sigma(output\_out)\) #根据情况可有可无,无的话则output_in即为output_out
5. y=output_out
6.
7. return \(y\)

output的输出结果为:\(y_j\),目标结果为\(t_j\)

令误差函数为\(E=\frac{1}{2}\sum_{j=0}^{n}{(y_j-t_j)^2}\),其中\(i\)为output layer的神经元个数

下面给出反向传播的伪代码:

Algorithm1: backprop
input: X,t,y,learn_rate
output: null
1. \(\delta_1=(y-t)\sigma^{'}(y)\) #output layer的梯度
2. \(\delta_2=\sigma^{'}(hidden\_output)\sum_{i=0}^{n}{w_{ho}\delta_1}\) #求解hidden layer的梯度
3.
4. \(w_{ih}-=learn\_rate*\delta_2\)
5. \(w_{ho}-=learn\_rate*\delta_1\)
6. \(b_{2}-=learn\_rate*\delta_2\)
7. \(b_{1}-=learn\_rate*\delta_1\)
8.
9. return

其中梯度求导原因如下: \[ \begin{array}{left} \frac{\partial E}{\partial w_{ij}}=\frac{\partial E}{\partial a{j}}\frac{\partial a_j}{\partial w_{ij}} \\ 其中:\\ E=\frac{1}{2}\sum_{j=0}^{n}{(y_j-t_j)^2}\\ a_j=\sum_i{w_{ij}z_i}\\ z_j=\sigma(a_j)\\ 那么:\\ \frac{\partial E}{\partial a{j}}=y_j-t_j \\ \delta \equiv\frac{\partial E}{\partial a{j}}\\ 则:\\ \frac{\partial E}{\partial w_{ij}}=\delta\frac{\partial a_j}{\partial w_{ij}}=\delta\sigma^{'}(a_j) \end{array} \]

拟合sin曲线

在实现中,output layer输出时不能采用Sigmoid函数激活,否则无法出现正常结果:

1
2
3
4
5
6
7
8
9
10
11
12
13
14
15
16
17
18
19
20
21
22
23
24
25
26
27
28
29
30
31
32
33
34
35
36
37
38
39
40
41
42
43
44
45
46
47
48
49
50
51
52
53
54
55
56
57
58
59
60
61
62
63
64
65
66
67
68
69
70
71
72
73
74
75
76
77
78
79
80
81
82
83
84
85
86
87
88
89
90
91
92
93
import numpy as np
import matplotlib.pyplot as plt


class NN:
def __init__(self, input_neurons, hidden_neurons, output_neurons, learning_rate, epochs):
self.input_neurons = input_neurons
self.hidden_neurons = hidden_neurons
self.output_neurons = output_neurons
self.epochs = epochs
self.lr = learning_rate

self.wih = np.random.normal(0, 1, (self.hidden_neurons, self.input_neurons))
self.bih = 0
self.who = np.random.normal(0, 1, (self.output_neurons, self.hidden_neurons))
self.bho = 0

def activation(self, Z):
return 1 / (1 + np.exp(-Z))

def sigmoid_derivative(self, Z):
return self.activation(Z) * (1 - self.activation(Z))

# 前向传播
def forward(self, input_list):
inputs = np.array(input_list, ndmin=2)
hidden_inputs = np.dot(self.wih, inputs) + self.bih
hidden_outputs = self.activation(hidden_inputs)
final_inputs = np.dot(self.who, hidden_outputs) + self.bho
final_outputs=final_inputs
return final_outputs

# 反向传播
def backprop(self, inputs_list, targets_list):
inputs = np.array(inputs_list, ndmin=2)
tj = np.array(targets_list, ndmin=2)
hidden_inputs = np.dot(self.wih, inputs) + self.bih
hidden_outputs = self.activation(hidden_inputs)
final_inputs = np.dot(self.who, hidden_outputs) + self.bho
yj = final_inputs
output_errors = (yj - tj)
hidden_errors = np.dot(self.who.T, output_errors)*self.sigmoid_derivative(hidden_outputs)
self.who -= self.lr * np.dot(output_errors , np.transpose(hidden_outputs))
self.wih -= self.lr * np.dot(hidden_errors, np.transpose(inputs))

# updating bias
self.bho -= self.lr * output_errors
self.bih -= self.lr * hidden_errors


def fit(self, inputs_list, targets_list):
loss_list=[]
for epoch in range(self.epochs):
self.backprop(inputs_list, targets_list)
y_pre=self.predict(inputs_list)
loss=np.sqrt(np.sum(np.square(y_pre-targets_list)))/2
loss_list.append(loss)
print(f"Epoch {epoch}/{self.epochs} ,loss:{loss}")
return loss_list

def predict(self, X):
outputs = self.forward(X).T
return outputs


if __name__ == "__main__":

plt.style.use('seaborn')
# 创建数据
x = np.linspace(0, 1, 100)
y = np.sin(2 * np.pi * x)

# 添加随机噪声
np.random.seed(20)
y_noisy = y + 0.05 * np.random.normal(size=x.shape)
nn = NN(1, 50, 1, 0.02,200)
loss=nn.fit(x, y_noisy)

x_test = np.linspace(0, 1, 100)
y_pred = nn.predict(x_test)
plt.figure()
plt.plot(x_test, y_pred, label='Regressor', color='#FFA628')
plt.plot(x, y, label='True function', color='g')
plt.scatter(x, y_noisy, edgecolor='b', s=20, label='Noisy samples')
plt.legend()
plt.tight_layout()
plt.show()

plt.figure()
plt.plot(np.linspace(3,len(loss),len(loss)-3),loss[3:])
plt.title('loss curve')
plt.tight_layout()
plt.show()

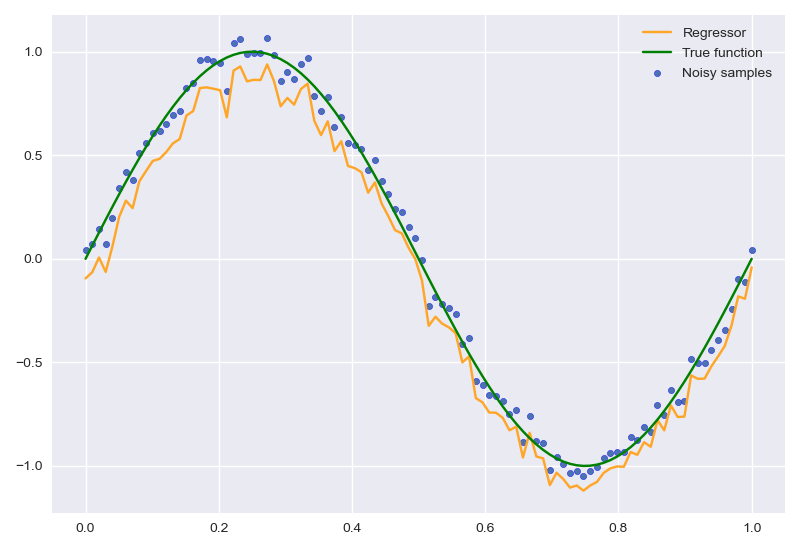
经过200次迭代后,结果如下:

image-20230507143232977

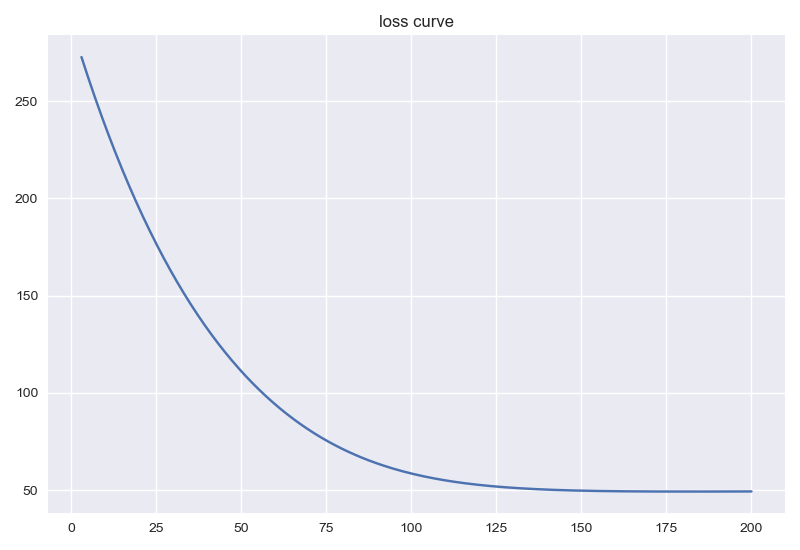
loss曲线如下:

image-20230507143309196

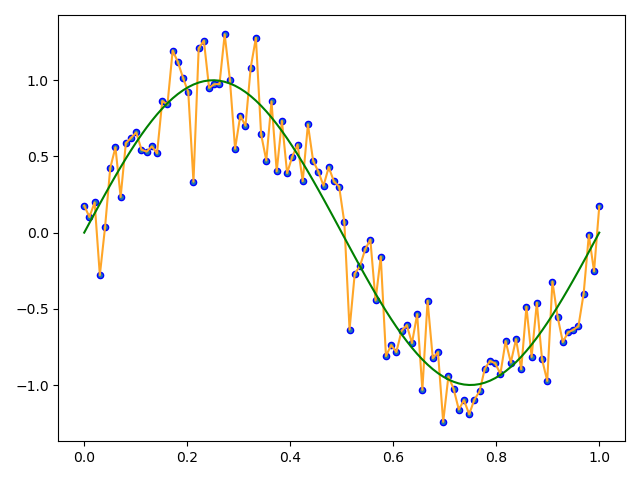
如果迭代2000次:

f624b4755450bca033368ecadb12ed7

可以看到有明显过拟合。

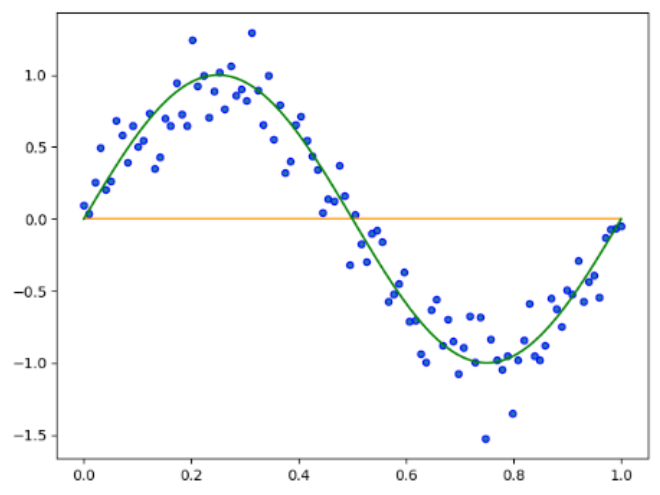
如果输出结果,采用Sigmoid函数处理:

image-20230507143624375

原因很简单,因为Sigmoid函数将数值缩放到了0,导致结果均为0,如果将误差符号反向,那么将得到一条y=1的直线作业八 神经网络初步

作业八 神经网络初步

sklearn中人工神经网络(ANN)主要提供的是多层感知机(MLP),其中有回归和分类两种,回归感知机还有能够自动实现交叉验证的版本。

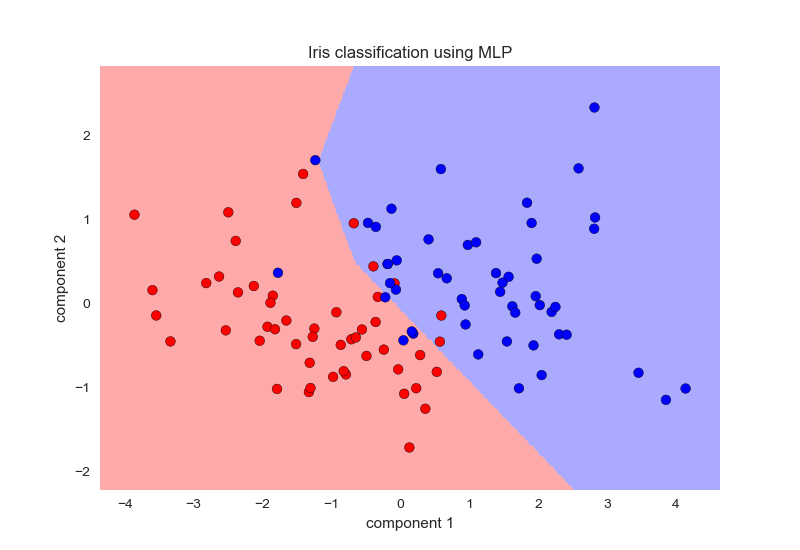
MLPClassifier二分类

流程如下:

  1. 导入iris数据,取后两类
  2. 标准化
  3. PCA得到x_pca,y
  4. 初始化MLP,训练
  5. 绘制分类面

代码如下:

1
2
3
4
5
6
7
8
9
10
11
12
13
14
15
16
17
18
19
20
21
22
23
24
25
26
27
28
29
30
31
32
33
34
35
36
37
38
39
40
41
42
43
44
45
46
47
48
49
50
51
52
53
from sklearn.neural_network import MLPClassifier
from sklearn import datasets
import numpy as np
from sklearn.linear_model import LogisticRegression
from sklearn.svm import l1_min_c
import matplotlib.pyplot as plt
from sklearn.decomposition import PCA
from sklearn.preprocessing import StandardScaler
from matplotlib.colors import ListedColormap

plt.style.use('seaborn')

def plot_decision_surface(model, X, y, grid_size=0.02):
# 获取数据范围
x_min, x_max = X[:, 0].min() - 0.5, X[:, 0].max() + 0.5
y_min, y_max = X[:, 1].min() - 0.5, X[:, 1].max() + 0.5

# 生成网格点
xx, yy = np.meshgrid(np.arange(x_min, x_max, grid_size), np.arange(y_min, y_max, grid_size))
Z = model.predict(np.c_[xx.ravel(), yy.ravel()])
Z = Z.reshape(xx.shape)

# 绘制分类面和训练数据
cmap_light = ListedColormap(['#FFAAAA', '#AAFFAA', '#AAAAFF'])
cmap_bold = ListedColormap(['#FF0000', '#00FF00', '#0000FF'])
plt.figure()
plt.pcolormesh(xx, yy, Z, cmap=cmap_light)
plt.scatter(X[:, 0], X[:, 1], c=y, cmap=cmap_bold, edgecolor='k')
plt.xlim(xx.min(), xx.max())
plt.ylim(yy.min(), yy.max())
plt.xlabel('Sepal length')
plt.ylabel('Sepal width')
plt.title('Iris classification using MLP')
plt.show()

iris = datasets.load_iris()
X = iris.data
y = iris.target

X = X[y != 0]
y = y[y != 0]
# 标准化
standard=StandardScaler()
X=standard.fit_transform(X)
# PCA
pca=PCA(n_components=2)
x_pca=pca.fit_transform(X)
# 初始化mlp
mlp=MLPClassifier(solver='lbfgs',hidden_layer_sizes=(5,2))

mlp.fit(x_pca,y)

plot_decision_surface(mlp, x_pca, y)

image-20230422220300024

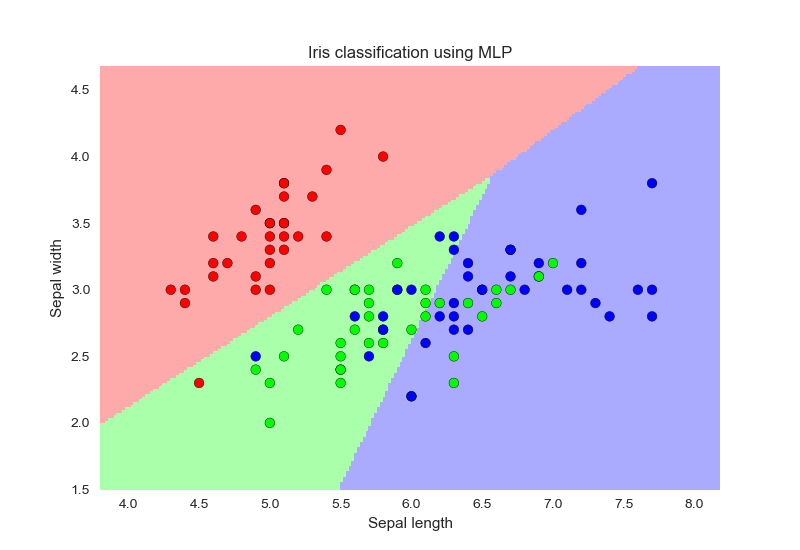
MLPClassifier多分类

流程如下:

  1. 导入iris数据
  2. 标准化
  3. PCA得到x_pca,y
  4. 初始化MLP,训练
  5. 绘制分类面
1
2
3
4
5
6
7
8
9
10
11
12
13
14
15
16
17
18
19
20
21
22
23
24
25
26
27
28
29
30
31
32
33
34
35
36
37
38
39
40
41
42
43
44
45
46
47
48
49
50
import numpy as np
import matplotlib.pyplot as plt
from sklearn.datasets import load_iris
from sklearn.neural_network import MLPClassifier
from sklearn.model_selection import train_test_split
from sklearn.metrics import plot_confusion_matrix
from matplotlib.colors import ListedColormap

plt.style.use('seaborn')

def plot_decision_surface(model, X, y, grid_size=0.02):
# 获取数据范围
x_min, x_max = X[:, 0].min() - 0.5, X[:, 0].max() + 0.5
y_min, y_max = X[:, 1].min() - 0.5, X[:, 1].max() + 0.5

# 生成网格点
xx, yy = np.meshgrid(np.arange(x_min, x_max, grid_size), np.arange(y_min, y_max, grid_size))
Z = model.predict(np.c_[xx.ravel(), yy.ravel()])
Z = Z.reshape(xx.shape)

# 绘制分类面和训练数据
cmap_light = ListedColormap(['#FFAAAA', '#AAFFAA', '#AAAAFF'])
cmap_bold = ListedColormap(['#FF0000', '#00FF00', '#0000FF'])
plt.figure()
plt.pcolormesh(xx, yy, Z, cmap=cmap_light)
plt.scatter(X[:, 0], X[:, 1], c=y, cmap=cmap_bold, edgecolor='k')
plt.xlim(xx.min(), xx.max())
plt.ylim(yy.min(), yy.max())
plt.xlabel('Sepal length')
plt.ylabel('Sepal width')
plt.title('Iris classification using MLP')
plt.show()


# 加载数据
iris = load_iris()
X = iris.data[:, :2] # 只使用前两个特征
y = iris.target

# 划分数据集
X_train, X_test, y_train, y_test = train_test_split(X, y, test_size=0.3, random_state=42)

# 创建多层感知器模型
mlp = MLPClassifier(hidden_layer_sizes=(10,), max_iter=1000, random_state=42)

# 训练模型
mlp.fit(X_train, y_train)

# 绘制分类面
plot_decision_surface(mlp, X_train, y_train)

image-20230422220443459

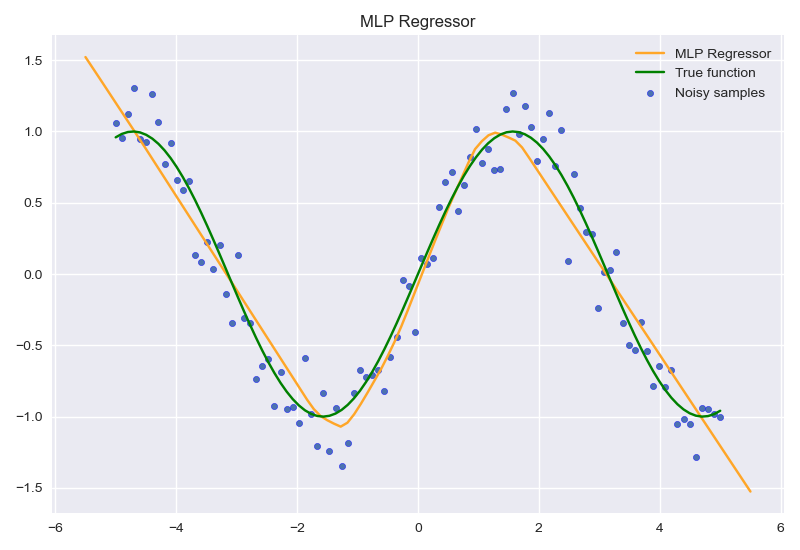
MLPRegressor

程序流程如下:

  1. 创建数据X,y
  2. 为y添加随机噪声
  3. 初始化MLP
  4. 训练MLP
  5. 绘制预测效果图

代码如下:

1
2
3
4
5
6
7
8
9
10
11
12
13
14
15
16
17
18
19
20
21
22
23
24
25
26
27
28
29
import numpy as np
import matplotlib.pyplot as plt
from sklearn.neural_network import MLPRegressor

plt.style.use('seaborn')
# 创建数据
x = np.linspace(-5, 5, 100)
y = np.sin(x)

# 添加随机噪声
np.random.seed(42)
y_noisy = y + 0.2 * np.random.normal(size=x.shape)

# 创建多层感知器模型
mlp = MLPRegressor(hidden_layer_sizes=(50,), max_iter=1000, random_state=42)

# 训练模型
mlp.fit(x.reshape(-1, 1), y_noisy)

# 预测并绘制结果
x_test = np.linspace(-5.5, 5.5, 100)
y_pred = mlp.predict(x_test.reshape(-1, 1))
plt.plot(x_test, y_pred, label='MLP Regressor',color='#FFA628')
plt.plot(x, y, label='True function',color='g')
plt.scatter(x, y_noisy, edgecolor='b', s=20, label='Noisy samples')
plt.legend()
plt.title('MLP Regressor')
plt.tight_layout()
plt.show()

image-20230422220624823

作业七 逻辑回归分类

由于都是从sklearn中调用,并不涉及什么复杂算法,因此下面采用列表的方式描述程序作用

二分类逻辑回归

首先说明下面程序的目的:

1.观察不同惩罚项系数对应参数变化
2.观察不同惩罚项系数对应错误率
3.可视化二分类结果

流程如下:

  1. 导入iris数据,取后两类
  2. 标准化
  3. PCA得到x_pca,y
  4. 初始化逻辑回归
  5. 调整参数c,分别训练逻辑回归得到权重参数和错误率
  6. 绘制错误率和权重参数曲线
  7. 绘制分类面

代码如下:

1
2
3
4
5
6
7
8
9
10
11
12
13
14
15
16
17
18
19
20
21
22
23
24
25
26
27
28
29
30
31
32
33
34
35
36
37
38
39
40
41
42
43
44
45
46
47
48
49
50
51
52
53
54
55
56
57
58
59
60
61
62
63
64
65
66
67
68
69
70
71
72
73
74
75
76
77
78
79
80
81
82
83
84
from sklearn import datasets
import numpy as np
from sklearn.linear_model import LogisticRegression
from sklearn.svm import l1_min_c
import matplotlib.pyplot as plt
from sklearn.decomposition import PCA

plt.style.use('seaborn')

iris = datasets.load_iris()
X = iris.data
y = iris.target
# 选出前两类
X = X[y != 0]
y = y[y != 0]
# 画出图像
plt.figure()
plt.scatter(X[y == 2, 0], X[y == 2, 1], color='r', label='0')
plt.scatter(X[y == 1, 0], X[y == 1, 1], color='g', label='1')
plt.legend()
plt.tight_layout()
plt.show()
# 训练
cs = l1_min_c(X, y, loss='log') * np.logspace(0, 7, 16)
# 初始化逻辑回归
clf = LogisticRegression(
penalty='l1',
solver='liblinear',
tol=1e-6,
max_iter=int(1e6),
warm_start=True,
intercept_scaling=1000.0,
)
# 错误率
errors = []
# 各个特征对参数
coefs_ = []
# 拟合观察参数
for c in cs:
clf.set_params(C=c)
clf.fit(X, y)
y_pre = clf.predict(X)
error = 0
for i in range(len(y)):
if y_pre[i] != y[i]:
error = error + 1
errors.append(error)
coefs_.append(clf.coef_.ravel().copy())
errors = np.array(errors) / len(y)
coefs_ = np.array(coefs_)
# 绘制参数变化
plt.plot(np.log10(cs), coefs_, marker="o")
ymin, ymax = plt.ylim()
plt.xlabel("log(C)")
plt.ylabel("Coefficients")
plt.title("Logistic Regression Path")
plt.axis("tight")
plt.show()
# 绘制错误率
plt.figure()
plt.plot(np.log10(cs), errors, marker='^', color='orange')
plt.ylabel('error rate')
plt.xlabel('log(C)')
plt.show()
# 最优拟合
clf.set_params(C=1)
clf.fit(X, y)

# PCA可视化
pca = PCA(n_components=2)
X1 = pca.fit_transform(X)
clf.set_params(C=1)
clf.fit(X1, y)

plt.figure()
plt.scatter(X1[y == 2, 0], X1[y == 2, 1], color='r', label='2')
plt.scatter(X1[y == 1, 0], X1[y == 1, 1], color='g', label='1')
plt.plot([min(X1[:, 0]), max(X1[:, 0])], [-(min(X1[:, 0]) * clf.coef_[0, 0] + clf.intercept_[0]) / clf.coef_[0, 1],
-(max(X1[:, 0]) * clf.coef_[0, 0] + clf.intercept_[0]) / clf.coef_[0, 1]],
label='classier', linewidth=3.0, color='black', linestyle='--')
plt.legend()
plt.xlabel('component 1')
plt.ylabel('component 2')
plt.show()

结果如下:

不同惩罚项对应的参数变化,可以看出当惩罚项小于1时,对于模型的稀疏化效果较好。
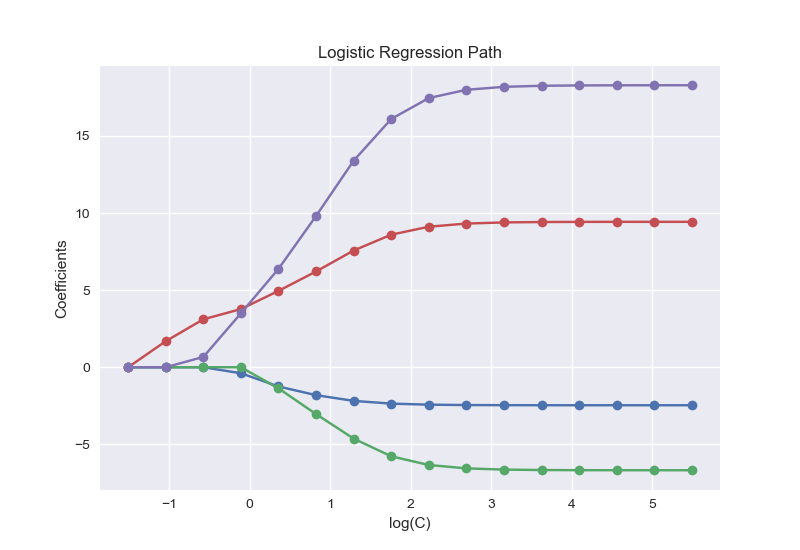
image-20230422214826267

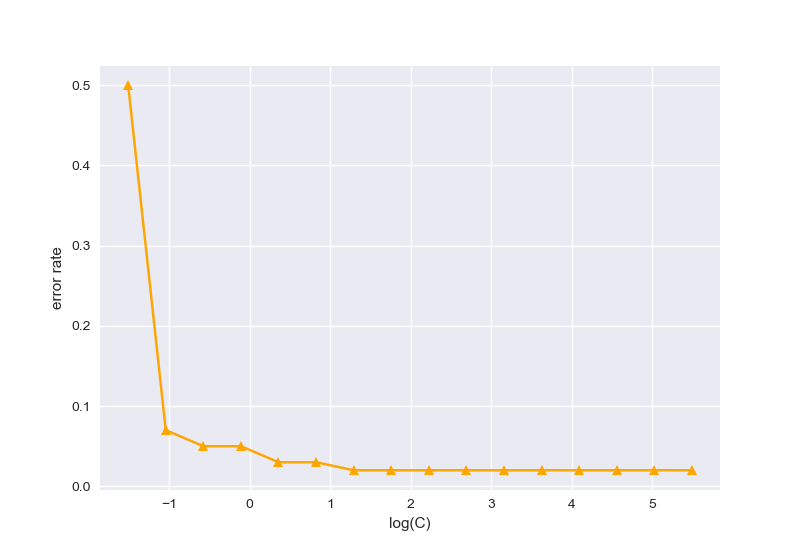
不同惩罚项系数对应的分类错误率,选择为10时效果较好;

image-20230422214946938

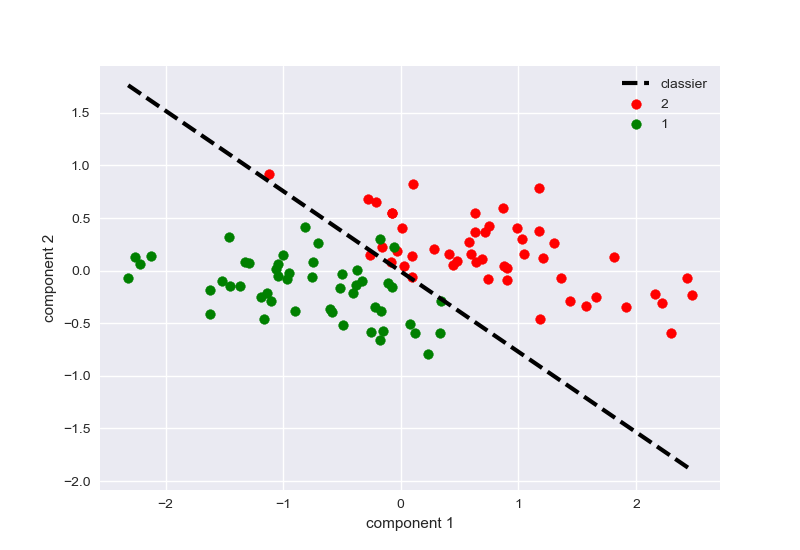
分类结果效果如图:

image-20230422215101050

多分类逻辑回归

首先说明下面程序的目的:

1.绘制多分类的分类面

流程如下:

  1. 导入iris数据
  2. 标准化
  3. PCA得到x_pca,y
  4. 初始化逻辑回归,训练逻辑回归
  5. 绘制分类面
1
2
3
4
5
6
7
8
9
10
11
12
13
14
15
16
17
18
19
20
21
22
23
24
25
26
27
28
29
30
31
32
33
34
35
36
37
38
39
40
41
42
43
44
45
46
47
48
from sklearn import datasets
import numpy as np
from sklearn.linear_model import LogisticRegression
from sklearn.svm import l1_min_c
import matplotlib.pyplot as plt
from sklearn.decomposition import PCA
from sklearn.preprocessing import StandardScaler

plt.style.use('seaborn')

iris = datasets.load_iris()
X = iris.data
y = iris.target
# 标准化
standard=StandardScaler()
X=standard.fit_transform(X)
# PCA
pca=PCA(n_components=2)
x_pca=pca.fit_transform(X)
# 初始化逻辑回归
clf = LogisticRegression(
solver='liblinear',
max_iter=int(1e6),
warm_start=True,
intercept_scaling=1000.0
)
clf.fit(x_pca,y)
coef,intercept=np.array(clf.coef_),np.array(clf.intercept_)

plt.figure()
plt.scatter(x_pca[y == 2, 0], x_pca[y == 2, 1], color='r', label='2')
plt.scatter(x_pca[y == 1, 0], x_pca[y == 1, 1], color='g', label='1')
plt.scatter(x_pca[y == 0, 0], x_pca[y == 0, 1], color='b', label='0')
plt.plot([min(x_pca[:, 0]), max(x_pca[:, 0])], [-(min(x_pca[:, 0]) * coef[0, 0] + intercept[0]) / coef[0, 1],
-(max(x_pca[:, 0]) * coef[0, 0] + intercept[0]) / coef[0, 1]],
label='classier', linewidth=3.0, color='black', linestyle='--')

plt.plot([min(x_pca[:, 0]), max(x_pca[:, 0])], [-(min(x_pca[:, 0]) * coef[1, 0] + intercept[1]) / coef[1, 1],
-(max(x_pca[:, 0]) * coef[1, 0] + intercept[1]) / coef[1, 1]],
label='classier', linewidth=3.0, color='black', linestyle='--')
plt.plot([min(x_pca[:, 0]), max(x_pca[:, 0])], [-(min(x_pca[:, 0]) * coef[2, 0] + intercept[2]) / coef[2, 1],
-(max(x_pca[:, 0]) * coef[2, 0] + intercept[2]) / coef[2, 1]],
label='classier', linewidth=3.0, color='black', linestyle='--')
plt.ylim(-5,5)
plt.legend()
plt.xlabel('component 1')
plt.ylabel('component 2')
plt.show()

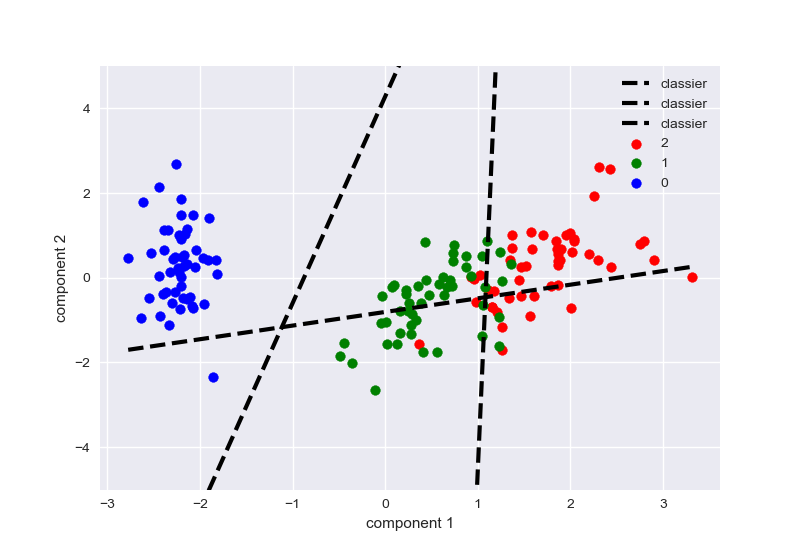
image-20230422215323041

作业六

Bayesian Linear Regression

所有算法都放在同一个Python文件下,函数算法伪代码如下:

Algorithm1: fit
input: X,t,degree, \(\alpha,\beta,\phi\)
output: \(m_n,S_n\)
1. \(if\) len(X.shape) == 1: # 预先判断形状
2. X=X.reshape(-1,1)
3. \(if\) len(t.shape) ==1:
4. t=t.reshape(-1,1)
5. \(S_n^{-1}=\alpha I+\beta\phi(X)^T\phi(X)\) # 计算协方差的逆
6. \(S_n=\)np.linalg.inv(\(S_n^{-1}\))
7. \(m_n=\beta S_n \phi(X)^Tt\) # 计算均值
8.
9. return \(m_n,S_n\)
Algorithm2: predict
input: X, \(\phi,m_n,S_n\)
output: \(mean,\sigma^2\)
1. \(\sigma^2\) = \(\frac{1}{\beta}+\phi(X)S_n\phi(X)^T\)
2. mean=\(\phi(x)m_n\)
3.
4. return mean, \(\sigma ^2\)

代码实现:

1
2
3
4
5
6
7
8
9
10
11
12
13
14
15
16
17
18
19
20
21
22
23
24
25
26
27
28
29
30
31
32
33
34
35
36
37
38
39
40
41
42
43
44
45
46
47
48
49
50
51
52
53
54
55
56
57
58
59
60
61
62
63
64
65
66
import numpy as np
import matplotlib.pyplot as plt
from sklearn.model_selection import train_test_split
from scipy.stats import multivariate_normal

from Polyfeature import Polyfeature
class BLR:
def __init__(self,n_features,alpha=0,beta=1,phi='linear'):
self.n_features=n_features
self.alpha=alpha
self.beta=beta
self.phi=phi
'''
alpha 表示w的先验的精度
beta 表示数据的精度
phi 表示基函数,可选参数为:linear、gaussain、polynomial、sigmoid
'''

def gaussian(self,x, mu, sigma):
return 1 / (sigma * np.sqrt(2 * np.pi)) * np.exp(-(x - mu) ** 2 / (2 * sigma ** 2))


def fit(self,X,t):
# 检查向量是否是二维数组并转化
if len(X.shape) == 1:
X=X.reshape(-1,1)
if len(t.shape) == 1:
t=t.reshape(-1,1)
# 是否要0均值?
global phi_x
global x
if self.phi=='linear':
phi_x=X
x=np.dot(phi_x,phi_x.T)
if self.phi=='polynomial':
polyf=Polyfeature(self.n_features)
phi_x=polyf.fit_transform(X)
x=np.dot(phi_x.T,phi_x)
# Sn的逆
Sn_inverse=self.alpha*np.eye(x.shape[0])+self.beta*x
# 计算期望
mn=self.beta*np.dot(np.dot(np.linalg.inv(Sn_inverse),phi_x.T),t)

self.phi_x=phi_x
self.Sn_inverse=Sn_inverse
self.mn=mn

def predict(self,X):
if self.phi=='linear':
if len(X.shape)==1:
X = X.reshape(-1, 1)
sigma2=1/self.beta+np.dot(np.dot(self.phi_x.T,np.linalg.inv(self.Sn_inverse)),self.phi_x)
t_pre=self.gaussian(X,self.mn,np.sqrt(sigma2))
return t_pre

if self.phi=='polynomial':
polyf=Polyfeature(self.n_features)
X=polyf.fit_transform(X)

sigma2 = np.diag(1 / self.beta + X @ np.linalg.inv(self.Sn_inverse) @ X.T).reshape(-1,1)
mean=np.dot(X,self.mn)

upper = mean + np.sqrt(sigma2)
lower = mean - np.sqrt(sigma2)

return mean,sigma2,upper,lower

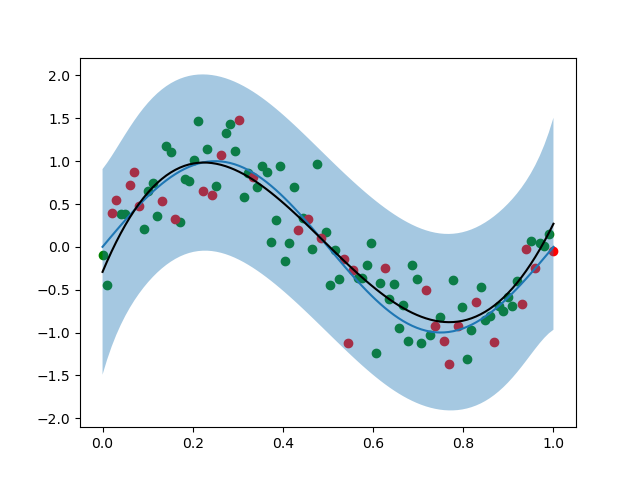
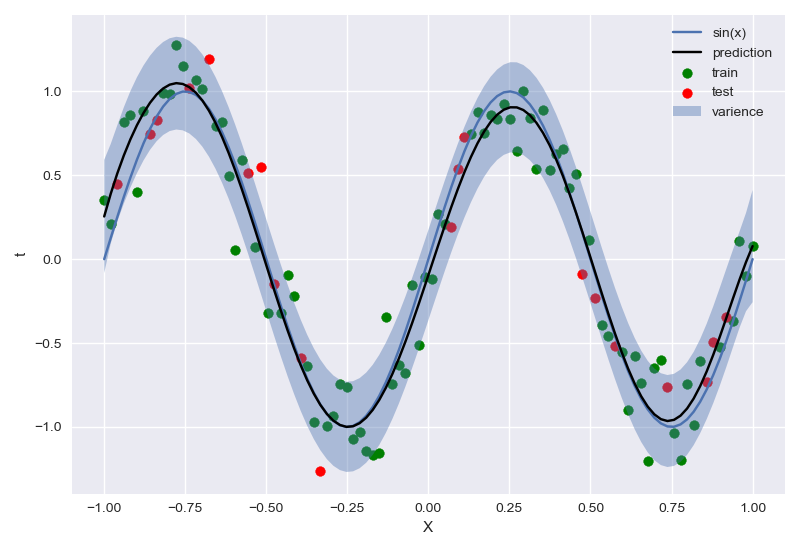
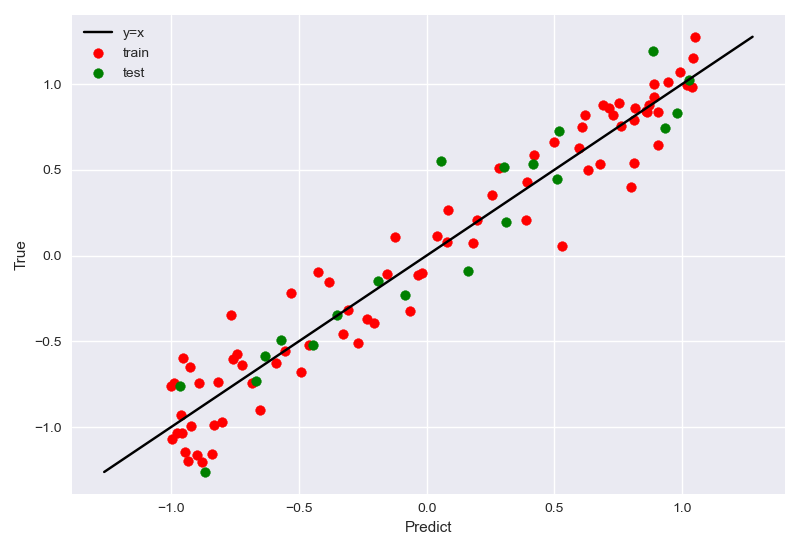
回归效果:

90e39f72c8da404c0738ddf8072aae4

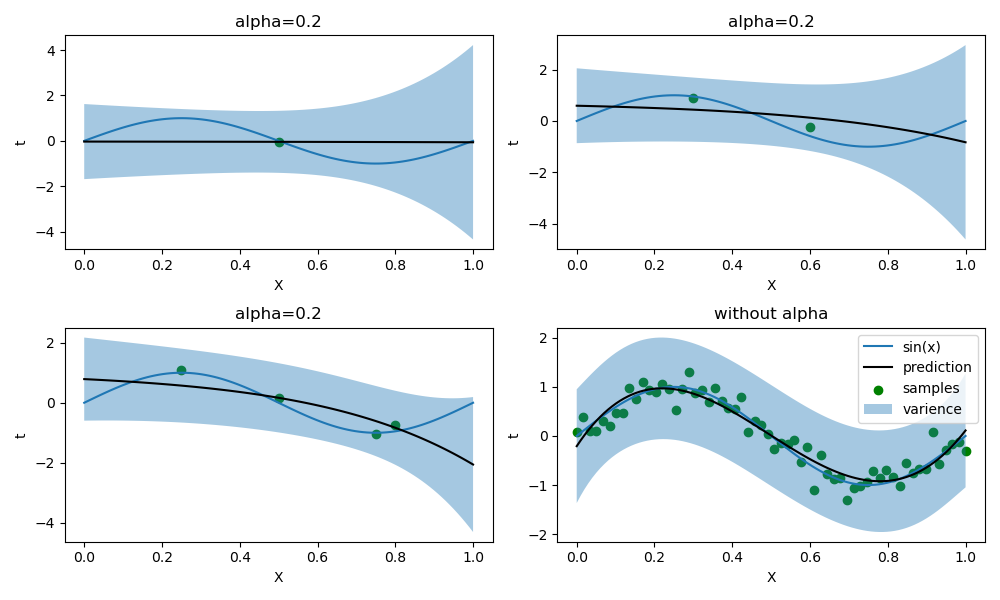
不同样本数量影响拟合效果

1
2
3
4
5
6
7
8
9
10
11
12
13
14
15
16
17
18
19
20
21
22
23
24
25
26
27
28
29
30
31
   x_1=np.linspace(0,1,100)
X_data=[np.array([0.5]),
np.array([0.3,0.6]),
np.array([0.25,0.5,0.75,0.8]),
np.linspace(0,1,60)]
j=1
plt.figure(figsize=(10,6))
for i in X_data:
plt.subplot(2,2,j)
t=np.sin(2*np.pi*i)+np.random.normal(loc=0,scale=0.2,size=i.shape)
if j<2:
blr = BLR(5, phi='polynomial',alpha=0.2)
plt.title('alpha=0.2')
else:
blr = BLR(4, phi='polynomial')
plt.title('without alpha')
j=j+1
# 绘制sin原图像
plt.plot(x_1,np.sin(2*np.pi*x_1),label='sin(x)')
# 绘制数据散点
plt.scatter(i, t, color='g',label='samples')
blr.fit(i, t)
plt.plot(x_1, blr.predict(x_1)[0], color='black',label='prediction')
# 绘制阴影部分
plt.fill_between(x_1.squeeze(), blr.predict(x_1)[3].squeeze(), blr.predict(x_1)[2].squeeze(), alpha=0.4,label='varience')

plt.xlabel('X')
plt.ylabel('t')
plt.legend()
plt.tight_layout()
plt.show()
image-20230408203151173

同时,我调整了样本数量较小时的\(\alpha\)值,下图是无正则化的情况(样本数量为1时,必须有正则化否则出现奇异矩阵):
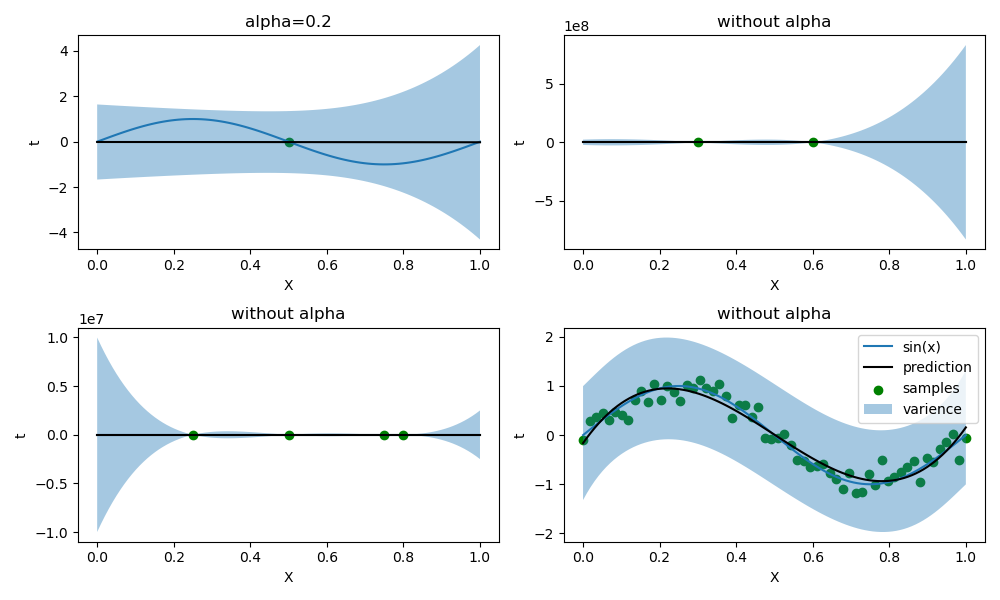
image-20230408203316307

交叉验证调优

因为要做调优,所以固定生成数据,设定种子为0。

在固定\(\alpha=0,beta=10\)时,首先确定degree:
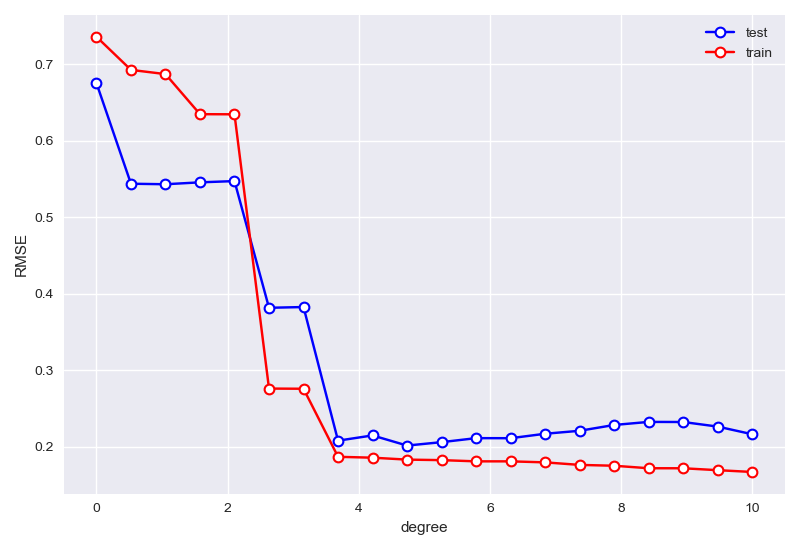
image-20230408213637573

best degree is 9 min RMSE in test sets: 0.2014522467351943

接下来在\(degrer=9\)的情况下,寻找\(\alpha\)的参数最优情况:
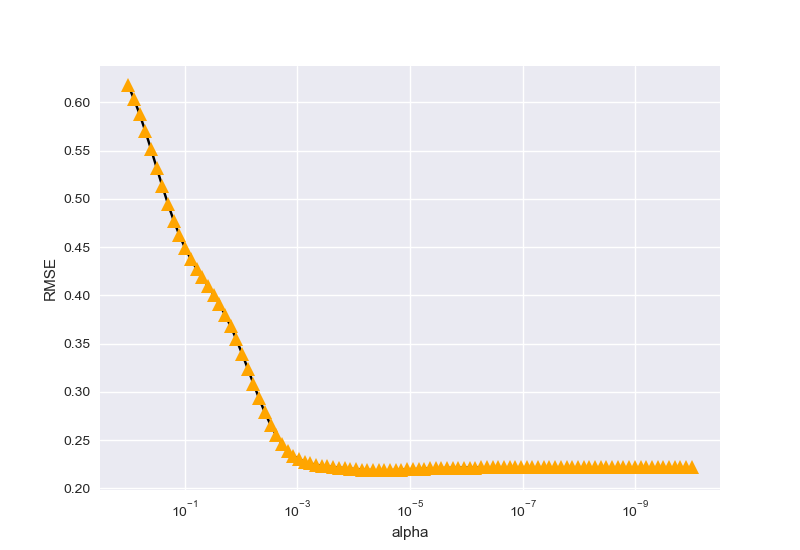
image-20230408221238294

parameter_best is 2.848035868435799e-05

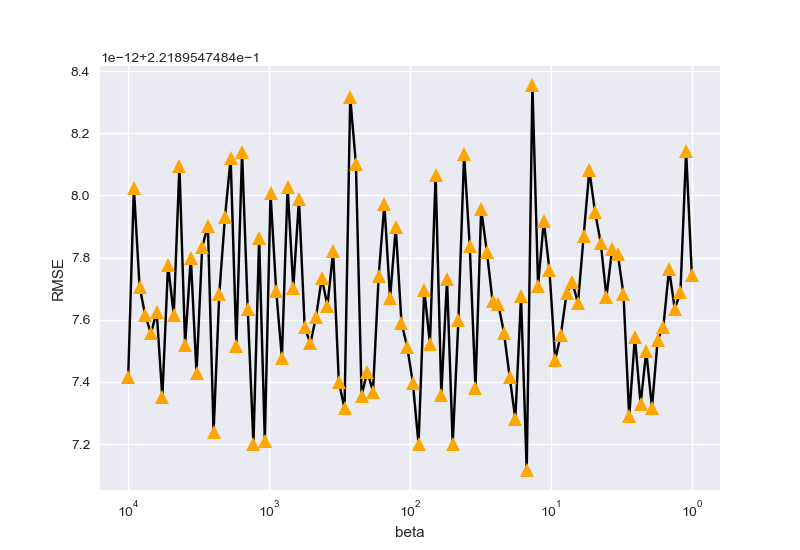
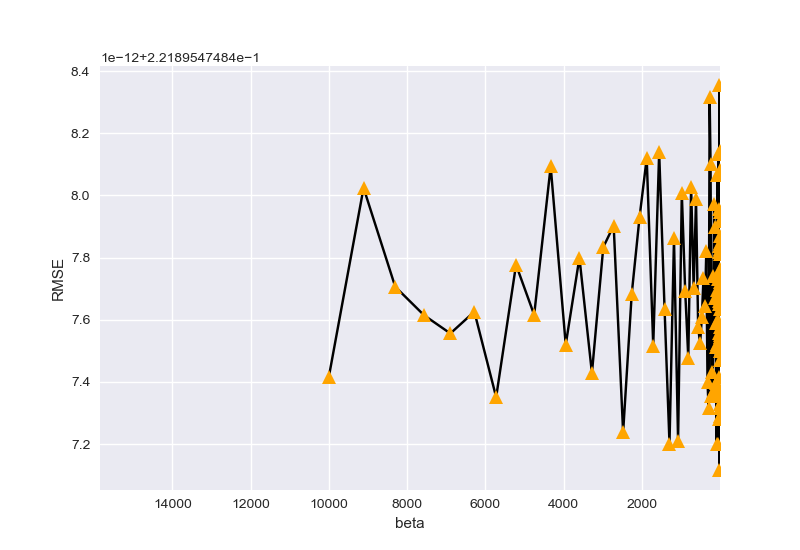
最后,按以上两种情况搜寻参数\(\beta\)

image-20230408221701245

image-20230408221719701

beta_best is 14.84968262254465

最终参数选择结果为:

\(\alpha\) 2.848035868435799e-05
\(degree\) 9
\(\beta\) 14.84968262254465

最终拟合结果:

image-20230408222416810

image-20230408222947483

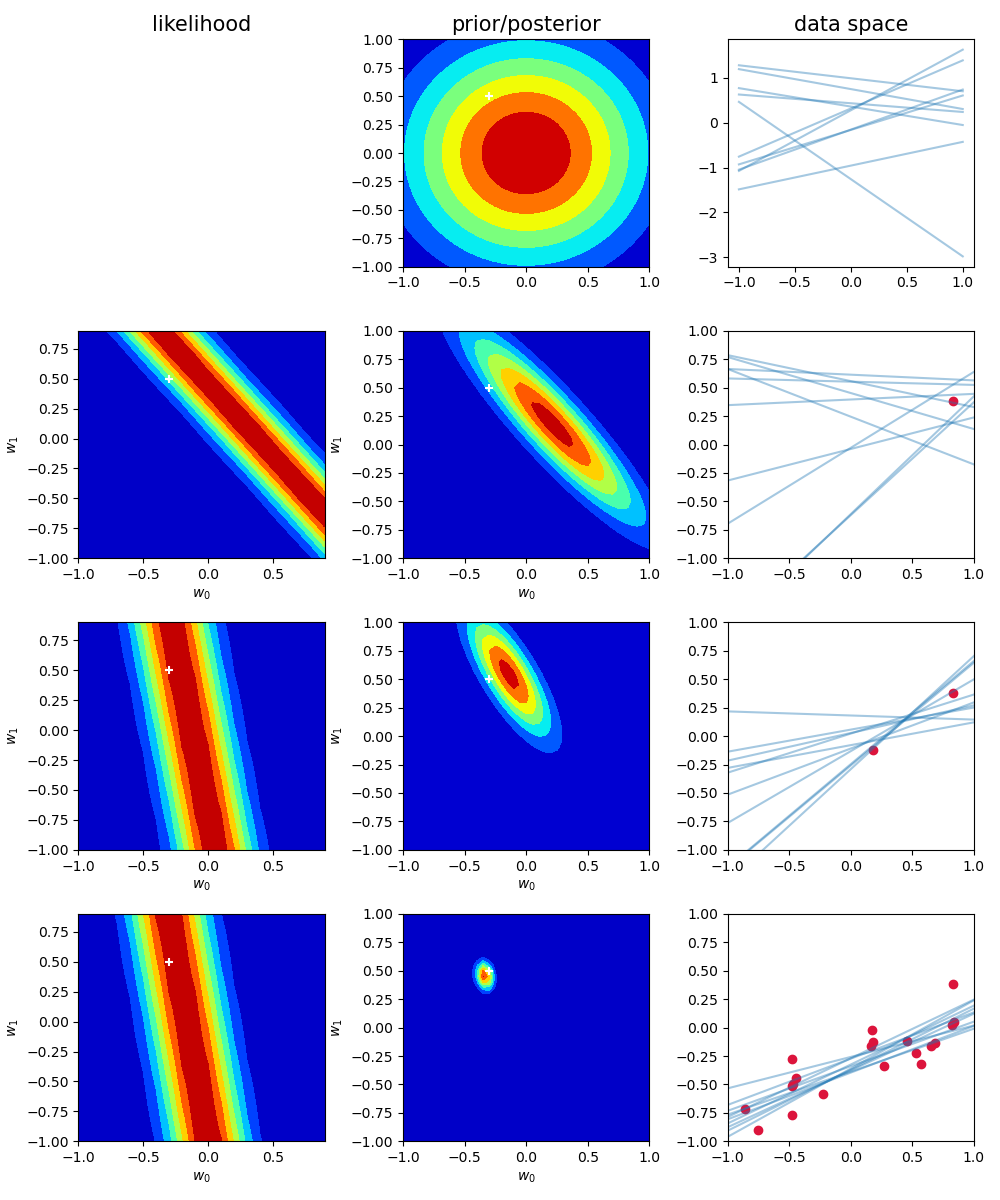
模拟拟合过程(似然、先验)

image-20230408233948782

1
2
3
4
5
6
7
8
9
10
11
12
13
14
15
16
17
18
19
20
21
22
23
24
25
26
27
28
29
30
31
32
33
34
35
36
37
38
39
40
41
42
43
44
45
46
47
48
49
50
51
52
53
54
55
56
57
58
59
60
61
62
63
64
65
66
67
68
69
70
71
72
73
74
75
76
77
78
79
80
81
82
83
84
85
86
87
88
89
90
import numpy as np
import matplotlib.pyplot as plt
from scipy.stats import multivariate_normal, norm
from numpy.random import seed, uniform, randn
from numpy.linalg import inv

def f(x, a):
return a[0] + a[1] * x

a = np.array([-0.3, 0.5])
N = 30
sigma = 0.2
X = uniform(-1, 1, (N, 1))
T = f(X, a) + randn(N, 1) * sigma

beta = (1 / sigma) ** 2 # precision
alpha = 2.0


def posterior_w(phi, t, S0, m0):
SN = inv(inv(S0) + beta * Phi.T @ Phi)
mN = SN @ (inv(S0) @ m0 + beta * Phi.T @ t)
return SN, mN


def sample_vals(X, T, ix):
x_in = X[ix]
Phi = np.c_[np.ones_like(x_in), x_in]
t = T[[ix]]
return Phi, t


def plot_prior(m, S, liminf=-1, limsup=1, step=0.05, ax=plt, **kwargs):
grid = np.mgrid[liminf:limsup + step:step, liminf:limsup + step:step]
nx = grid.shape[-1]
z = multivariate_normal.pdf(grid.T.reshape(-1, 2), mean=m.ravel(), cov=S).reshape(nx, nx).T

return ax.contourf(*grid, z, cmap='jet',interpolation='nearest',**kwargs)


def plot_sample_w(mean, cov, size=10, ax=plt):
w = np.random.multivariate_normal(mean=mean.ravel(), cov=cov, size=size)
x = np.linspace(-1, 1)
for wi in w:
ax.plot(x, f(x, wi), c="tab:blue", alpha=0.4)


def plot_likelihood_obs(X, T, ix, ax=plt):
W = np.mgrid[-1:1:0.1, -1:1:0.1]
x, t = sample_vals(X, T, ix)
mean = W.T.reshape(-1, 2) @ x.T

likelihood = norm.pdf(t, loc=mean, scale=np.sqrt(1 / beta)).reshape(20, 20).T
ax.contourf(*W, likelihood,cmap='jet',interpolation='nearest')
ax.scatter(-0.3, 0.5, c="white", marker="+")


SN = np.eye(2) / alpha
mN = np.zeros((2, 1))

seed(1643)
N = 20
nobs = [1, 2, 20]
ix_fig = 1
fig, ax = plt.subplots(len(nobs) + 1, 3, figsize=(10, 12))
plot_prior(mN, SN, ax=ax[0, 1])
ax[0, 1].scatter(-0.3, 0.5, c="white", marker="+")
ax[0, 0].axis("off")
plot_sample_w(mN, SN, ax=ax[0, 2])
for i in range(0, N + 1):
Phi, t = sample_vals(X, T, i)
SN, mN = posterior_w(Phi, t, SN, mN)
if i + 1 in nobs:
plot_likelihood_obs(X, T, i, ax=ax[ix_fig, 0])
plot_prior(mN, SN, ax=ax[ix_fig, 1])
ax[ix_fig, 1].scatter(-0.3, 0.5, c="white", marker="+")
ax[ix_fig, 2].scatter(X[:i + 1], T[:i + 1], c="crimson")
ax[ix_fig, 2].set_xlim(-1, 1)
ax[ix_fig, 2].set_ylim(-1, 1)
for l in range(2):
ax[ix_fig, l].set_xlabel("$w_0$")
ax[ix_fig, l].set_ylabel("$w_1$")
plot_sample_w(mN, SN, ax=ax[ix_fig, 2])
ix_fig += 1

titles = ["likelihood", "prior/posterior", "data space"]
for axi, title in zip(ax[0], titles):
axi.set_title(title, size=15)
plt.tight_layout()
plt.show()

作业五

等价核绘制

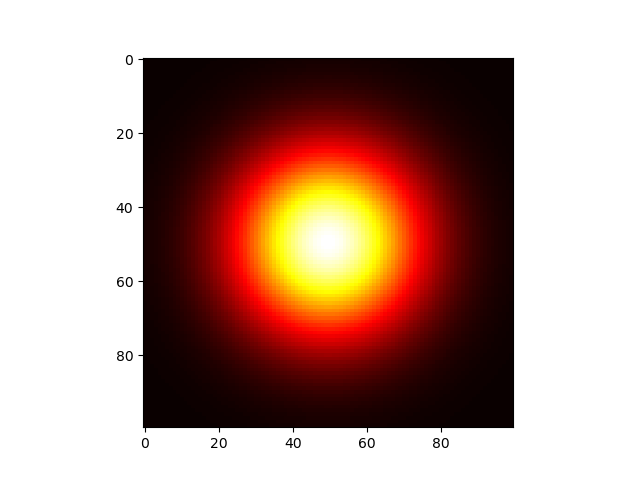
首先是高斯核的绘制,下图是一个取值为线性的高斯核函数的图像image-20230402182640901
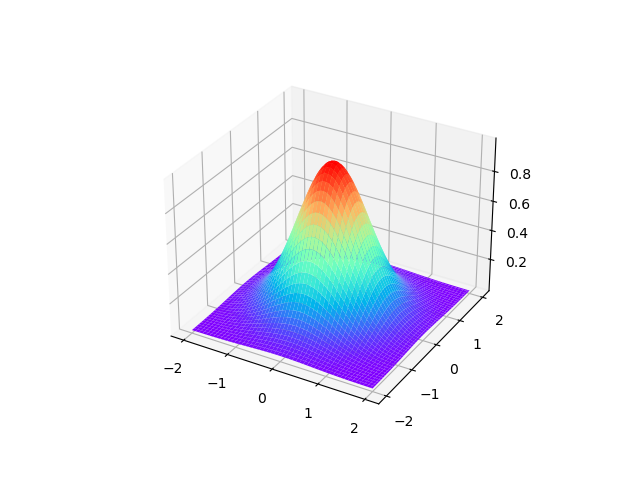
image-20230402182755965

1
2
3
4
5
6
7
8
9
10
11
12
13
14
15
16
17
18
19
20
21
22
23
24
25
26
27
28
29
30
31
32
33
34
import matplotlib.pyplot as plt
import numpy as np

def gaussianLike(mu,sigma,x):
return np.exp((-1/2)*np.matmul(np.matmul((x-mu),np.linalg.inv(sigma)),(x-mu).reshape(len(x),1)))

def gaussianKernel(gaussianLike,x):
return np.dot(gaussianLike(np.zeros(2,),np.eye(2,2),x),gaussianLike(np.zeros(2,),np.eye(2,2),x))

x=np.linspace(-2,2,100)
y=np.linspace(-2,2,100)
X, Y = np.meshgrid(x, y)
Z=[]
z1=np.ones((100,100))
for i in x:
n=0
z=[]
for j in y:
m=0
z.append(gaussianKernel(gaussianLike,[i,j]))
z1[n,m]=gaussianKernel(gaussianLike,[i,j])
m+=1
n+=1
Z.append(z)
Z=np.array(Z)

plt.imshow(Z,cmap='hot')
plt.show()


plt.figure()
ax = plt.axes(projection='3d')
ax.plot_surface(X,Y,Z,cmap='rainbow')
plt.show()

下面复现课本的等价核:

高斯核

1
2
3
4
5
6
7
8
9
10
11
12
13
14
15
16
17
18
19
20
21
22
23
24
25
26
27
28
29
30
import numpy as np
import matplotlib.pyplot as plt

def gaussian_kernel(x, y, sigma):
return np.exp(-np.linalg.norm(x - y)**2 / (2 * (sigma ** 2)))

def compute_kernel_matrix(X, sigma):
n = X.shape[0]
K = np.zeros((n, n))
for i in range(n):
for j in range(i, n):
K[i, j] = gaussian_kernel(X[i], X[j], sigma)
K[j, i] = K[i, j]
return K

# 生成示例数据集
X = np.linspace(-5, 5, 100).reshape(-1, 1)
y = np.sin(X)

# 计算不同带宽参数下的高斯等价核矩阵
sigmas = [0.1, 1, 10]
for sigma in sigmas:
K = compute_kernel_matrix(X, sigma)

# 绘制高斯核形状图像
plt.figure()
plt.imshow(K, cmap='jet', interpolation='nearest')
plt.title(r'Gaussian Kernel with $\sigma=$' + str(sigma))
plt.colorbar()
plt.show()
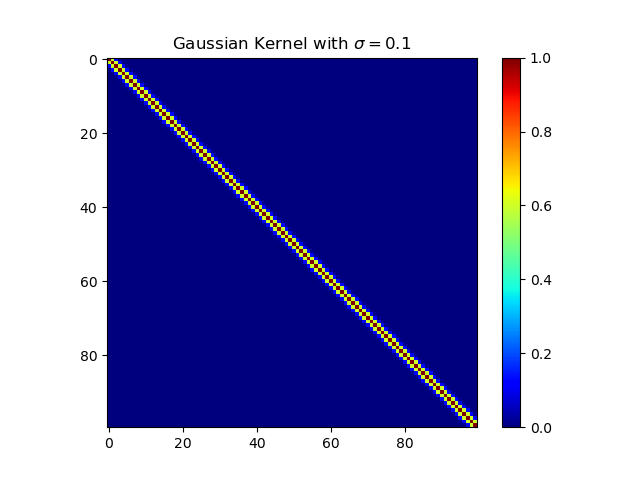
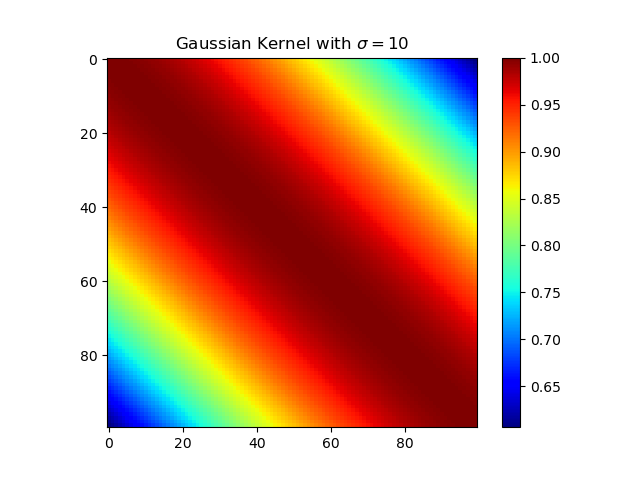
image-20230402183003203
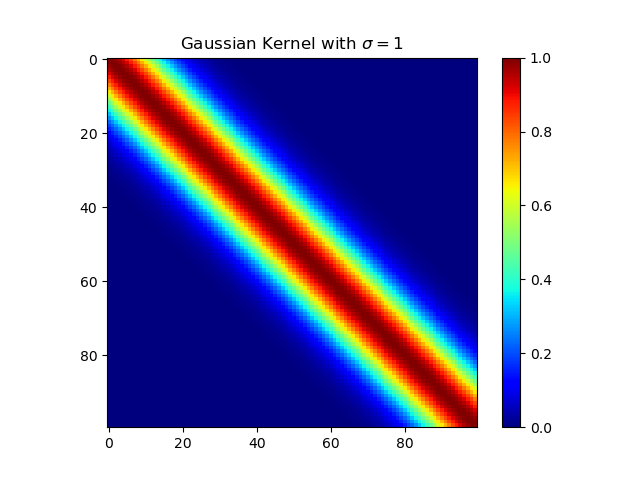
image-20230402183010833
image-20230402183017836

多项式核

1
2
3
4
5
6
7
8
9
10
11
12
13
14
15
16
17
18
19
20
21
22
23
24
25
26
27
28
29
30
31
32
import numpy as np
import matplotlib.pyplot as plt

def polynomial_kernel(x, y, degree, coef0=0):
return (np.dot(x, y) + coef0) ** degree

def compute_kernel_matrix(X, degree, coef0=0):
n = X.shape[0]
K = np.zeros((n, n))
for i in range(n):
for j in range(i, n):
K[i, j] = polynomial_kernel(X[i], X[j], degree, coef0)
K[j, i] = K[i, j]
return K

# 生成示例数据集
X = np.linspace(-5, 5, 100).reshape(-1, 1)
y = np.sin(X)

# 计算不同阶数和常数项参数下的多项式核矩阵
degrees = [2, 3, 4]
coef0s = [-1, 0, 1]
for degree in degrees:
for coef0 in coef0s:
K = compute_kernel_matrix(X, degree, coef0)

# 绘制多项式核形状图像
plt.figure()
plt.imshow(K, cmap='jet', interpolation='nearest')
plt.title('Polynomial Kernel with degree=' + str(degree) + ' and coef0=' + str(coef0))
plt.colorbar()
plt.show()
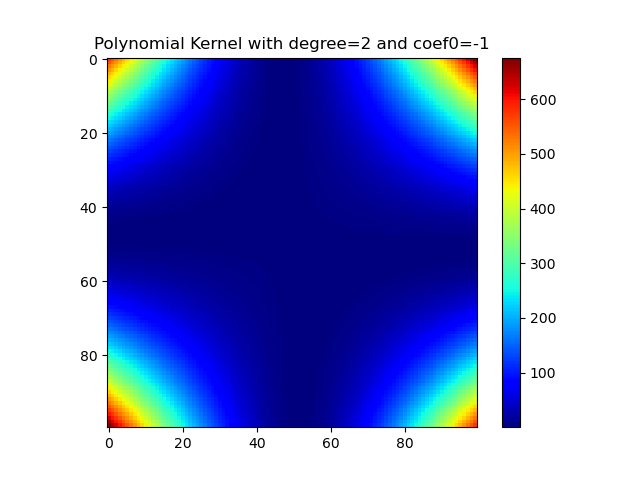
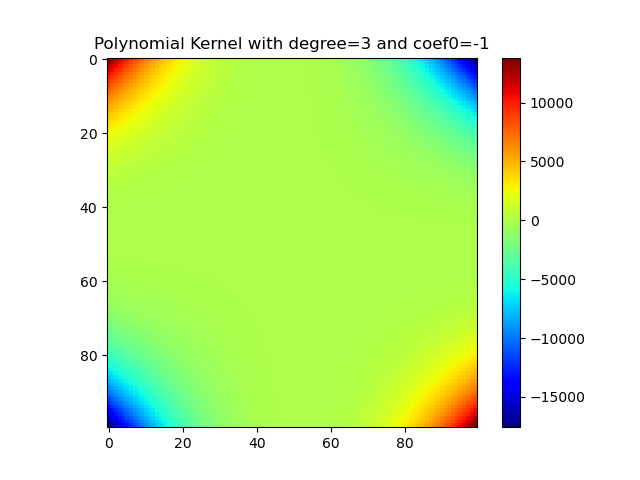
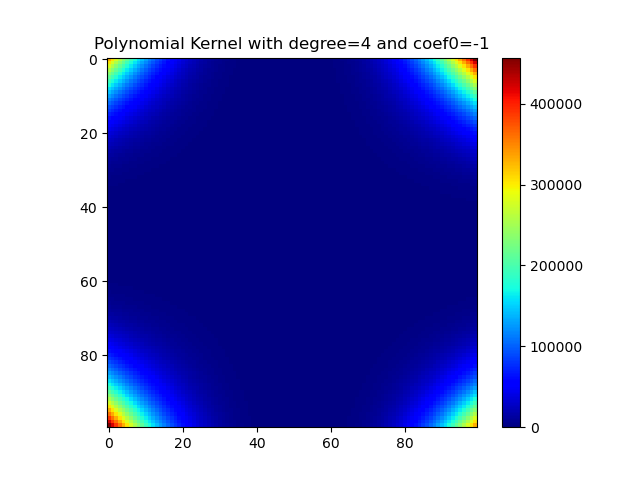
image-20230402183116818
image-20230402183128404
image-20230402183137656

Sigmoid核

1
2
3
4
5
6
7
8
9
10
11
12
13
14
15
16
17
18
19
20
21
22
23
24
25
26
27
28
29
30
31
32
import numpy as np
import matplotlib.pyplot as plt

def sigmoid_kernel(x, y, alpha, c):
return np.tanh(alpha * np.dot(x, y) + c)

def compute_kernel_matrix(X, alpha, c):
n = X.shape[0]
K = np.zeros((n, n))
for i in range(n):
for j in range(i, n):
K[i, j] = sigmoid_kernel(X[i], X[j], alpha, c)
K[j, i] = K[i, j]
return K

# 生成示例数据集
X = np.linspace(-5, 5, 100).reshape(-1, 1)
y = np.sin(X)

# 计算不同超参数下的 Sigmoid 核矩阵
alphas = [0.1, 0.5, 1]
cs = [-1, 0, 1]
for alpha in alphas:
for c in cs:
K = compute_kernel_matrix(X, alpha, c)

# 绘制 Sigmoid 核形状图像
plt.figure()
plt.imshow(K, cmap='jet', interpolation='nearest')
plt.title('Sigmoid Kernel with alpha=' + str(alpha) + ' and c=' + str(c))
plt.colorbar()
plt.show()
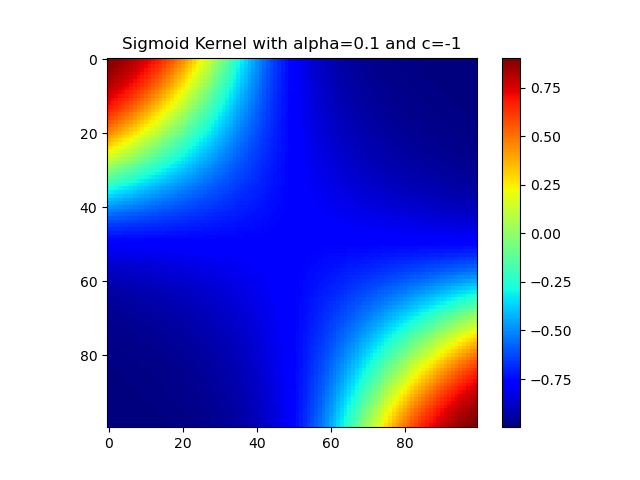
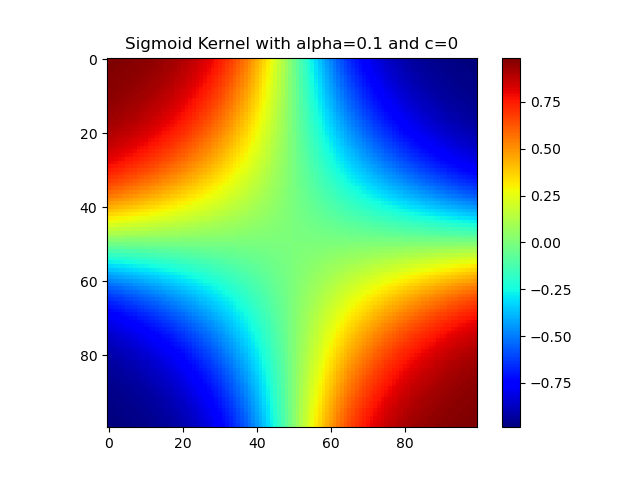
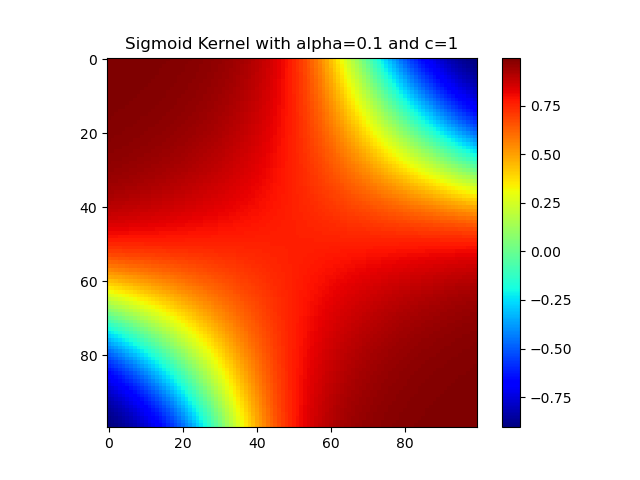
image-20230402183249517
image-20230402183257364
image-20230402183304889

似然

1
2
3
4
5
6
7
8
9
10
11
12
13
14
15
16
17
18
19
20
21
22
23
24
25
26
27
28
29
30
31
32
33
34
35
36
37
38
39
40
41
42
43
44
45
46
47
48
49
50
51
52
53
54
55
56
from scipy import stats
import numpy as np
import random
import matplotlib.pyplot as plt

random.seed(615)
def get_synth_data(N, beta):
X_N =np.random.uniform(-1,1, N)
X_N = np.column_stack((np.ones(N), X_N))
# for this example the true function is f(x,a) = a_0 + a_1*x
# where a_0 = -.3 and a_1 = .5 are the parameters that we
# are going to estimate
a = np.array([-.3, .5])
t = np.dot(X_N, a)
return X_N, t + np.random.normal(loc=0.0, scale=np.sqrt(1./beta), size=N)

beta_ = 25.0
alpha = 2.0
N = 20
X_N, t_N = get_synth_data(N, beta_)
x = np.linspace(-1, 1, 70)
y = np.linspace(-1, 1, 70)


w0, w1 = np.meshgrid(x, y)
m_0 = [0, 0]
S_0 = 1/alpha * np.eye(2)

n = 1
X_n = X_N[range(n), :]
t_n = t_N[range(n)]
plt.xlim(-1, 1);
plt.ylim(-1, 1)
plt.scatter(X_n[:, 1], t_n)
plt.title("First point in the data set")
plt.xlabel('x');
plt.ylabel('y')
plt.show()


def likelihood(t_, x, w, beta):
from math import sqrt
return stats.norm.pdf(t_,loc=np.dot(w,x), scale=sqrt(1./beta))

Z = np.zeros((len(y), len(x)))
for i, w1 in enumerate(y):
for j, w0 in enumerate(x):
Z[i, j] = likelihood(t_n[-1], X_n[-1,:], np.array([w0, w1]), beta_)
extent = (-1,1,-1,1)
plt.imshow(Z, extent=extent, origin='lower')
plt.plot(-0.3, 0.5, 'w+', markeredgewidth=2, markersize=12)
plt.title("Likelihood of the first point in the data set, white cross = true value")
plt.xlabel("w0")
plt.ylabel("w1")
plt.show()
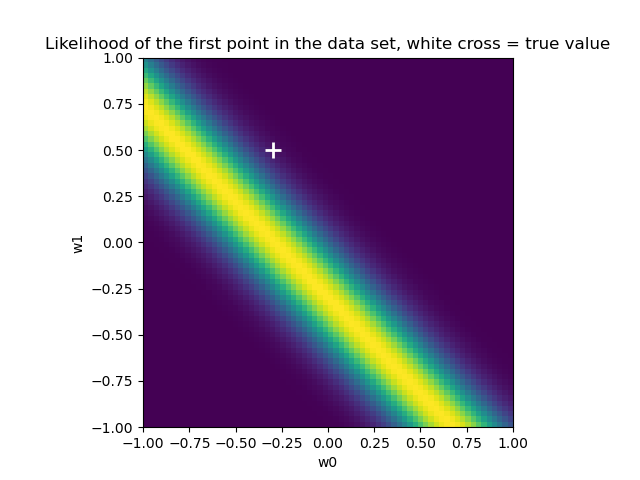
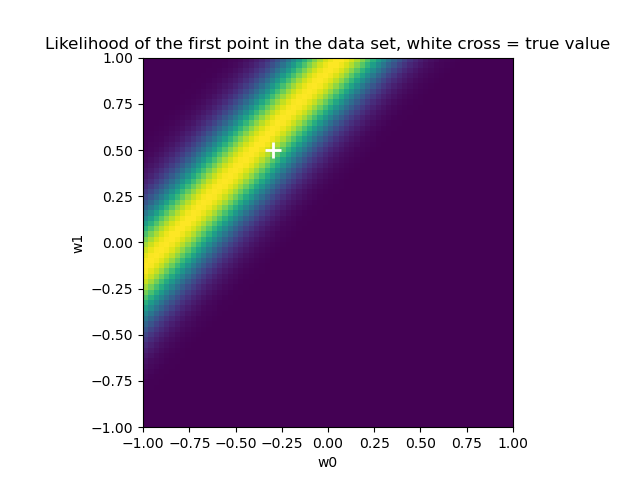
image-20230402184647229
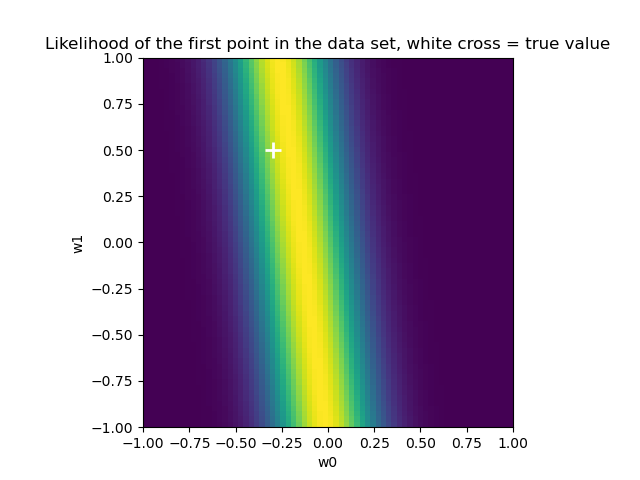
image-20230402184827621
image-20230402184922104

作业一 多项式拟合

理论推导

\[ \min ||f(\omega;x)-t||^2\\ \sum_{i=0}^{n}{\omega_i*x_i^j}=t \]

写成矩阵形式: \[ XW=T \] 使用平方和最小来衡量,设损失函数: \[ L(x)=\frac{1}{2}\sum^{N}_{i=1}{(\sum_{j=0}^{M}{\omega_jx_i^j-y_i)^2}} \] 对损失函数求导,令导数等于0: \[ \begin{array}{l} \frac{\partial L(x;\omega)}{\partial \omega_i}=0 \\ \\ \frac{1}{2}\sum_{i=1}^{N}{2(\sum^{j=0}_{M}{\omega_jx_i^j-y_i)}\times x_i^k}=0 \\ \\ \sum_{i=1}^{N}{\sum^{M}_{j=1}{\omega_ix_i^{j+k}}}=\sum_{j=1}^{M}{x_i^ky_i}(k=0,1,2,3,\cdots,M) \end{array} \] 那么就有: \[ \begin{array}{l} X=\sum^M_{j=1}{x_i^{j+k}} \\ W=\omega_i \\ Y=\sum_{i=1}^{M}{x_i^ky_i}\\ XW=Y \end{array} \] 将以\(x\)为参数的非线性模型转化为以\(w\)的线性模型,从而转化为矩阵方程求解问题,需要将方程特征进行组合,实现上使用sklearn,进行多项式特征组合,然后使用线性回归进行预测:

算法语言描述:

  1. 生成一个(特征数目+1,特征数目+1)的矩阵

  2. 分别计算0-特征阶数的幂

  3. 返回特征混合矩阵

  4. 线性回归

代码实现

1
2
3
4
5
6
7
8
9
10
11
12
13
14
15
16
17
18
19
20
21
22
23
24
25
26
27
import numpy as np

class Polyfeature():
def __init__(self,n_features):
self.n_features=n_features

# 一元特征混合
def fit(self, x):
xf = np.zeros((len(x), self.n_features + 1))
for i in range(self.n_features + 1):
xf[:,i] = np.power(x, i).reshape(np.shape(xf[:,i]))
self.xf=xf
return xf

def transform(self,x):
xf = np.zeros((len(x), self.n_features + 1))
for i in range(self.n_features + 1):
xf[:, i] = np.power(x, i).reshape(np.shape(xf[:, i]))
self.xf = xf
return xf

def fit_transform(self, x):
xf = np.zeros((len(x), self.n_features + 1))
for i in range(self.n_features + 1):
xf[:, i] = np.power(x, i).reshape(np.shape(xf[:, i]))
self.xf = xf
return xf
1
2
3
4
5
6
7
8
9
10
11
12
13
14
import numpy as np
class linearregression():
def fit(self,x,y,Lambda=0):
c = np.dot(x.T, x)
I = np.eye(np.shape(c)[0])
d = np.dot(Lambda, I)
e = (c + d)
e = np.linalg.inv(e)
w = np.dot(x.T, y)
w = np.dot(e, w)
self.w = w
def predict(self,x):
y=np.dot(x,self.w)
return y
1
2
3
4
5
6
7
8
9
10
11
12
13
14
15
16
17
18
19
20
21
22
23
24
25
26
27
28
29
30
31
32
33
34
35
36
37
38
39
40
41
42
43
44
45
46
47
48
49
50
51
52
53
54
55
56
57
58
59
60
61
62
63
64
65
66
67
68
69
70
71
72
73
74
75
76
77
78
79
80
81
82
83
84
85
86
87
88
89
90
91
92
import math

import numpy as np
from sklearn.model_selection import train_test_split
from sklearn.preprocessing import PolynomialFeatures
from sklearn.linear_model import LinearRegression
import matplotlib.pyplot as plt

class polyregression():
def __init__(self,features):
self.n_features=features
# 生成数据
def create_data(self,n):
self.n=n
X=np.random.rand(n,1)
# 考虑到需要保证高斯白噪声的0均值
noise=0.3*np.random.uniform(low=-1, high=1, size=(n,1))
t=np.sin(X*2*math.pi)+noise
self.X=X
self.t=t

# 划分数据集
def splitData(self):
X_train, X_test, T_train, T_test = train_test_split(self.X, self.t, test_size=0.3, random_state=0)
self.X_train=X_train
self.X_test=X_test
self.T_train=T_train
self.T_test=T_test

# 多项式拟合
def fit(self):
poly = PolynomialFeatures(self.n_features)
x_train_poly = poly.fit_transform(self.X_train)

lin=LinearRegression()
lin.fit(x_train_poly,self.T_train)

self.lin=lin
self.poly=poly

def draw(self):
plt.style.use('seaborn')
plt.figure()
plt.plot(np.linspace(0,1,50),np.sin(np.linspace(0,1,50)*2*math.pi),color='green')
plt.scatter(self.X,self.t,marker='o',edgecolor='blue',color='white',linewidths='1.1')
plt.plot(np.linspace(0,1,50),self.lin.predict(self.poly.transform(np.linspace(0,1,50).reshape(-1,1))),color='red')
s='n_features='+str(self.n_features)
plt.text(0.7,1,s)
plt.xlabel('X')
plt.ylabel('Y')
plt.savefig('features='+str(self.n_features)+' samples='+str(self.n)+'.png')
plt.show()
# 衡量拟合的标准
def RSME(self):
T_test_predict=self.lin.predict(self.poly.transform(self.X_test))
SSE=np.sum(np.square(self.T_test-T_test_predict))
MSE=SSE/len(T_test_predict)
rsme=np.sqrt(MSE)
return rsme
if __name__=='__main__':
# 对不同特征选择的比较
def features_test():
RSME=[]
for i in range(10):
poly=polyregression(i)
poly.create_data(20)
poly.splitData()
poly.fit()
poly.draw()
RSME.append(poly.RSME())

plt.figure()
plt.plot(np.linspace(0,10,10),RSME,marker='^',label="points")
plt.show()
# 对不同样本数量的比较
def samples_test():
for j in [20,200,500]:
RSME=[]
for i in range(50):
poly=polyregression(i)
poly.create_data(j)
poly.splitData()
poly.fit()
poly.draw()
RSME.append(poly.RSME())
plt.figure()
plt.plot(np.linspace(0,50,50),RSME,marker='^',label="points")
plt.savefig('sample='+str(j)+'.png')
plt.show()

# features_test()
samples_test()

结果对比

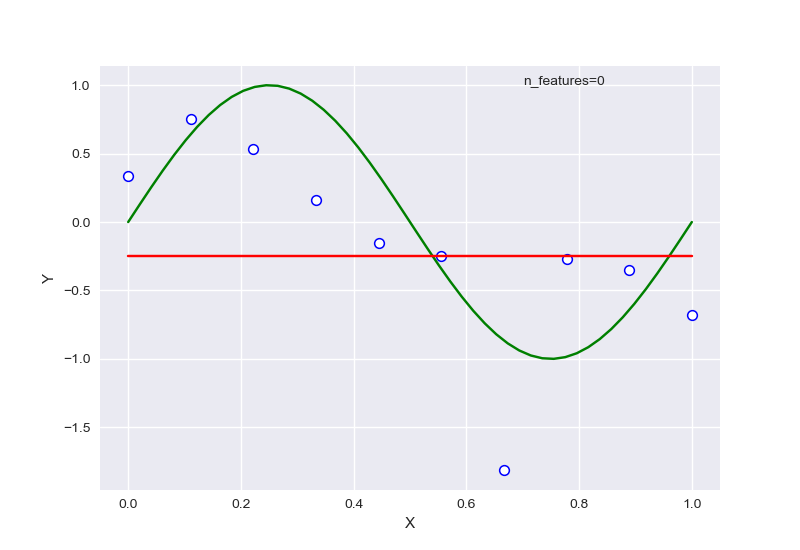
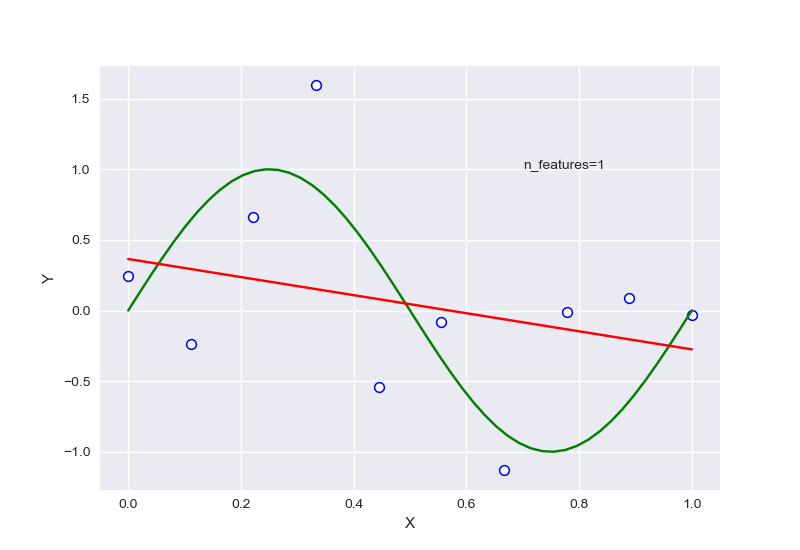
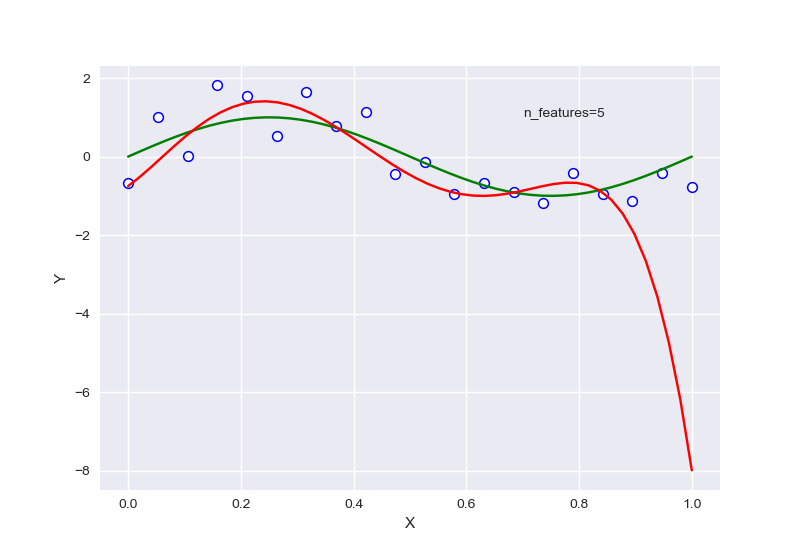
不同的特征数量,首先全部针对样本数量为10的情况: features=0 samples=10

features=1 samples=10
features=2 samples=10
features=3 samples=10
features=4 samples=10
features=5 samples=10

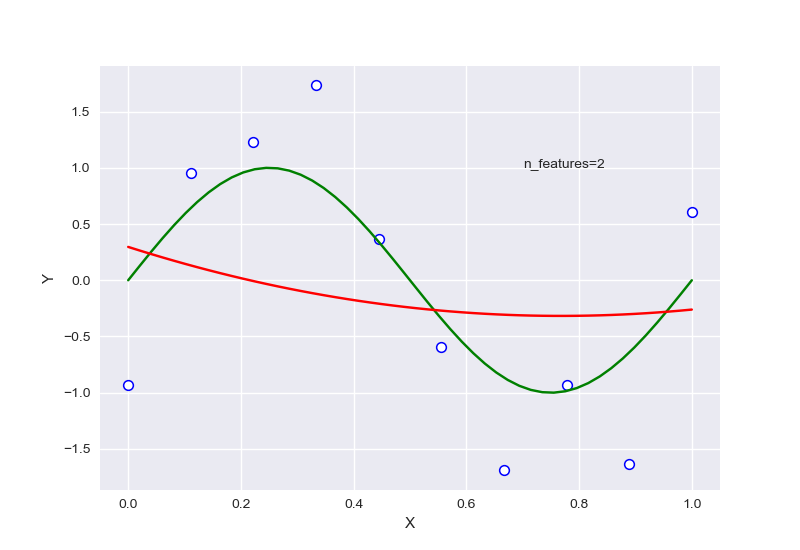
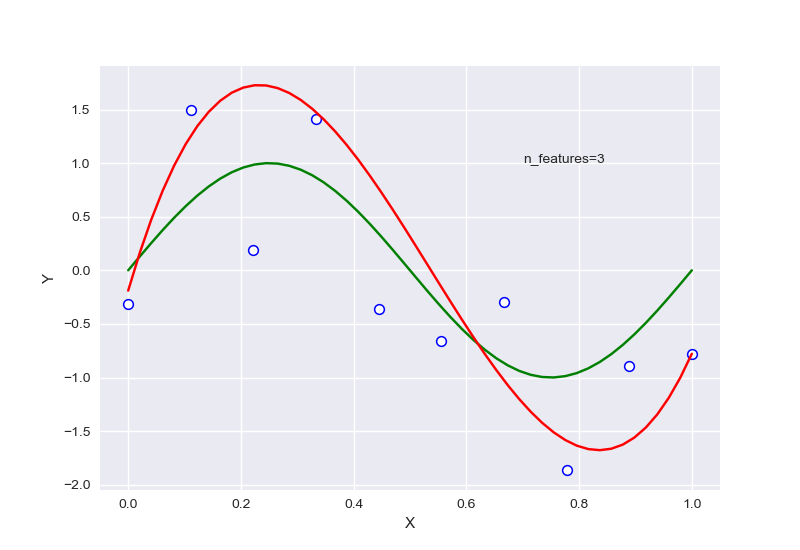
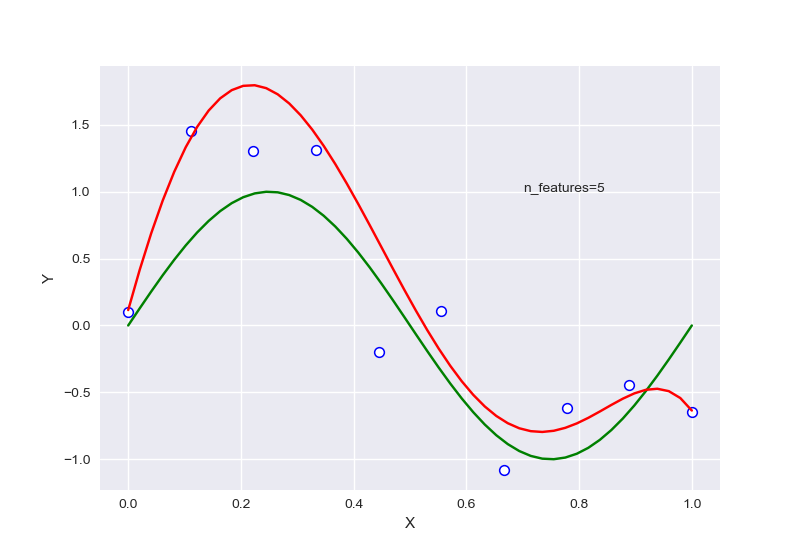
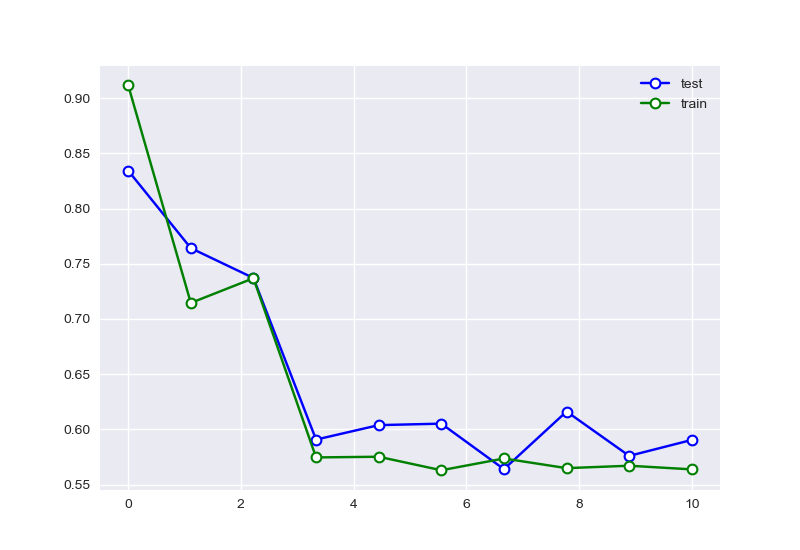
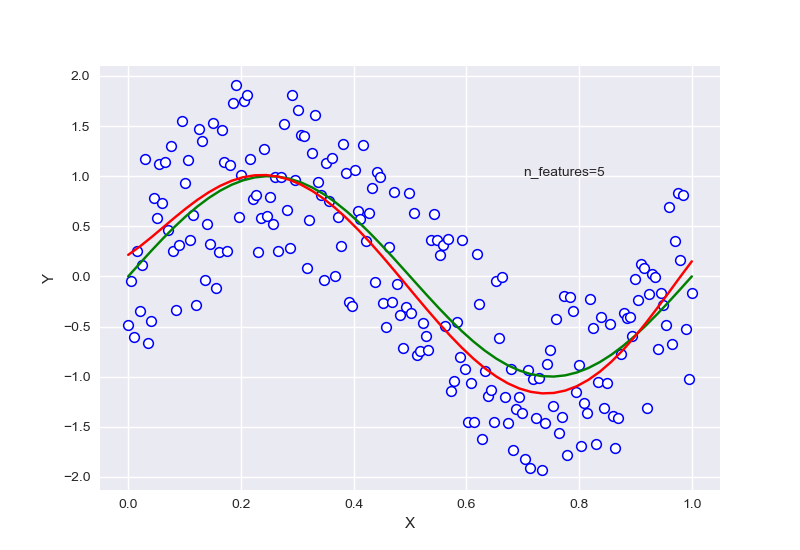
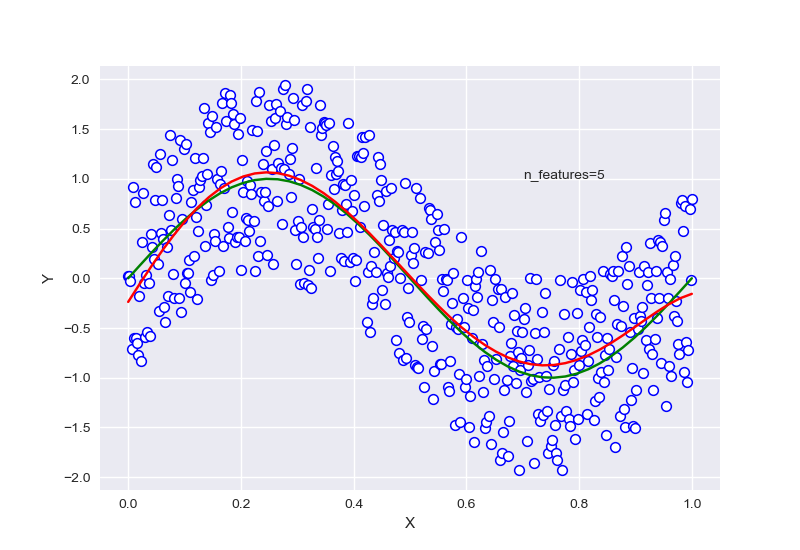
从中可以大致看出,在选择特征过少时,会出现欠拟合现象,选择过多后则会过拟合,针对样本量为20的情况下,RSME曲线如图: sample=20.png 图上显示的情况,并不是与我们预期中的情况完全吻合,其原因可能是因为测试集样本数量过少,导致无法很好的捕捉曲线拟合的问题,于是我们对其他样本数量进行对比 、 sample=200.png sample=500.png
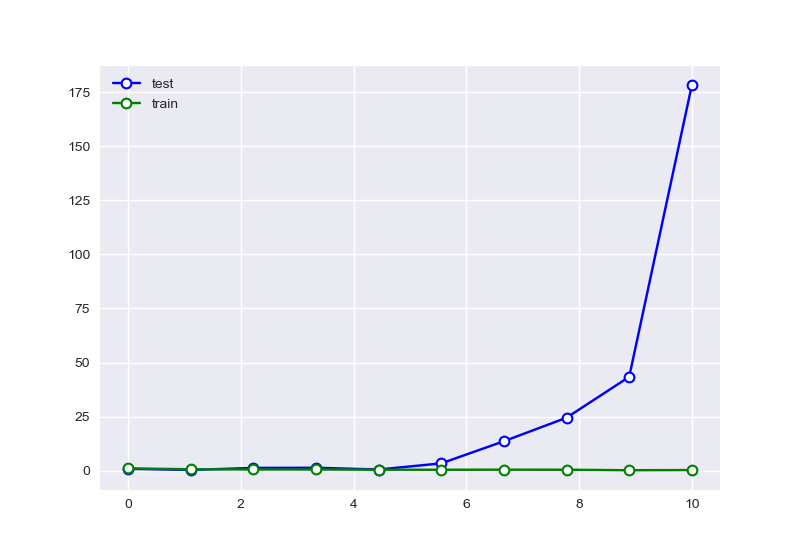
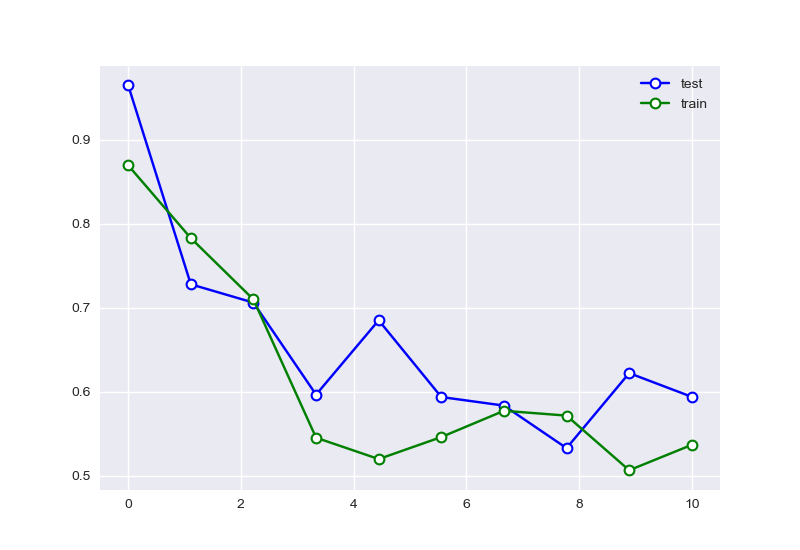
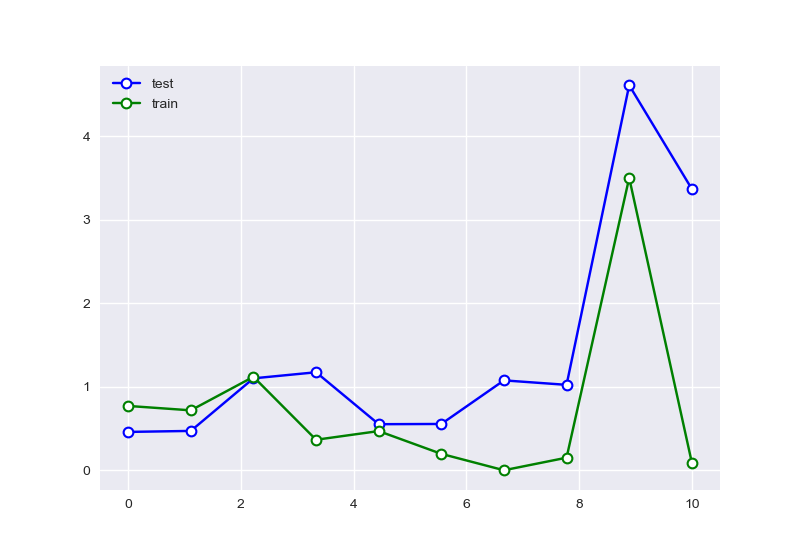
可以看出样本数量增多后,特征的选择有明显的趋势。尝试复现使用样本为10的情况: sample=10 且样本数量会明显的影响拟合的效果。
features=5 samples=10
features=5 samples=20
features=5 samples=200
features=5 samples=500

针对样本为10,特征为5的情况下进行正则化:

\(\lambda\)=0.7740859059011267
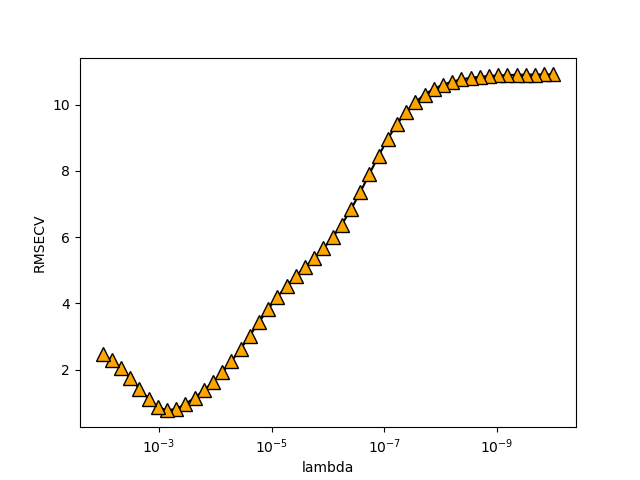
image-20230311220541756

作业二

频率学派与贝叶斯学派

  • 频率观点认为频率能够趋近概率,模型的参数是一定的,只要采样数目足够多就能逼近参数值,我的理解是其符合大数定律的思想(此为辛钦大数定律): \[ \lim_{n\to \infty}P\left(\left|\frac{1}{n}\sum_{i=1}^{n}{a_i-\mu} \right|< \varepsilon\right)=1 \]
  • 贝叶斯观点认为模型的参数是在变化的,样本是一定的。 \[ p(w|D)=\frac{p(D|w)p(w)}{p(D)} \] 以一元高斯分布为例,解释样本分布问题:
  • 频率: 频率的思想是以样本代替总体,从而得到模型参数,假设有数据集\(D=\{x_1,x_2,\cdot\cdot\cdot,x_n\}\),则估计得到的一元高斯分布的参数为 \[ \hat\mu=\frac{1}{n}\sum_{i=1}^{n}{x_i} \] \[ \hat{\sigma^2}=\frac{1}{n}\sum_{i=1}^{n}{(x_i-\hat\mu)}^2 \] 样本分布显然是和总体有差异的,对其求期望可以得到,均值为无偏估计,而方差存在偏差,而偏差随着样本数目n的增大而减小(\(E(\hat\sigma^2)=\frac{n-1}{n}\sigma^2\))。
  • 贝叶斯: 贝叶斯的思想认为所有参数都是一个分布,而样本是固定不变的量。所以通过先验尽可能使逼近高斯分布。 \[ p(D|w)=\frac{p(w|D)p(D)}{p(w)} \] 有似然函数,其中\(p(D)\)为一个常数,可被忽略(归一化),根据课本给出的高斯分布求解结果,发现他的方差和均值均为无偏估计。 ## 公式推导 image-20230421154051248
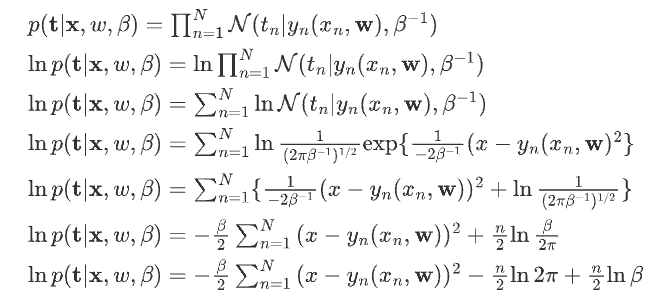
引入先验

image-20230421154116419

在这里将数据的概率分布进行了归一,认为样本概率为一常数

image-20230421154257436

然后对\(\ln p(\mathbf{w}|\alpha)\)求解:

image-20230421154321678

取负数:
\[ -\ln p(\mathbf{t|x},w,\beta)p(\mathbf{w}|\alpha)= \frac{\beta}{2}\sum_{n=1}^{N} {(x-y_n(x_n,\mathbf{w}))^2 } +\frac{\alpha}{2}\mathbf{w^T}\mathbf{w} -\frac{n}{2}\ln \frac{\beta}{2\pi}-\frac{M+1}{2}\ln \alpha+\frac{M+1}{2} \ln 2\pi \] 后三项均为常数,对最大化没有任何影响,因此损失函数为:

image-20230421154342936

作业三

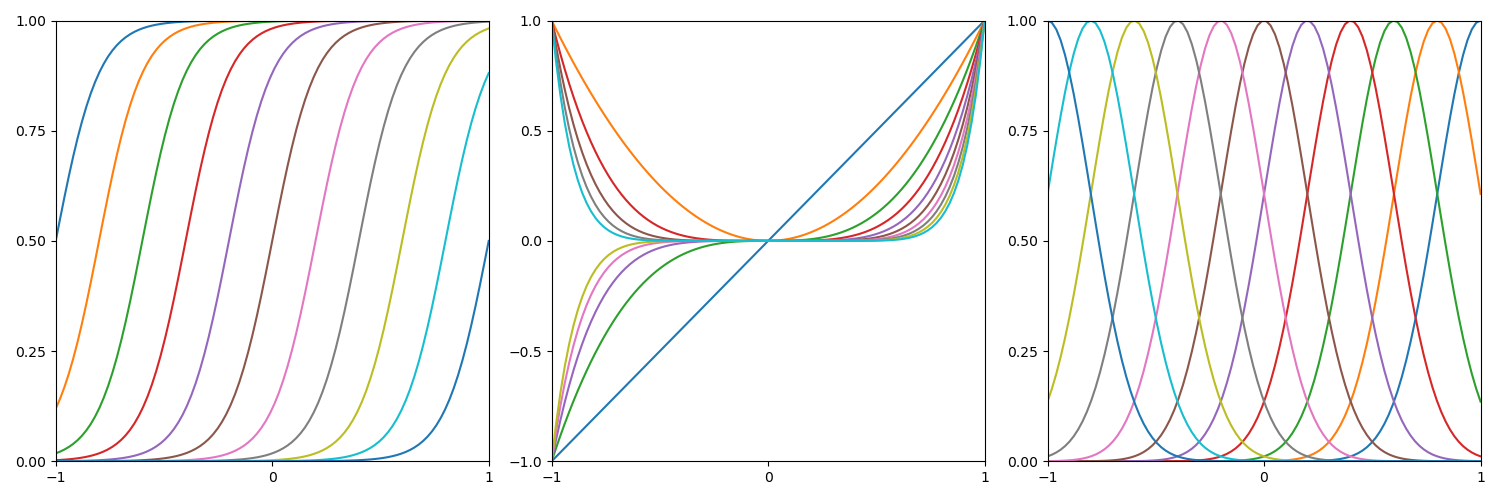
基函数图像复现

1
2
3
4
5
6
7
8
9
10
11
12
13
14
15
16
17
18
19
20
21
22
23
24
25
26
27
28
29
30
31
32
33
34
35
36
37
38
39
40
41
42
43
44
45
46
47
48
49
50
51
52
53
54
55
56
57
58
59
60
61
62
63
import matplotlib.pyplot as plt
import numpy as np
from matplotlib.ticker import MultipleLocator

x_major_locator=MultipleLocator(1)
y_major_locator=MultipleLocator(0.25)

plt.figure(figsize=(15,5))
plt.subplot(1,3,1)
def sigma(x,b):
return 1/(np.exp((-x+b)*10)+1)
x=np.linspace(-1,1,100)
b=np.linspace(-1,1,11).tolist()
for bi in b:
plt.plot(x,sigma(x,bi))
plt.xlim(-1,1)
plt.ylim(0,1)
ax=plt.gca()
ax.xaxis.set_major_locator(x_major_locator)
ax.yaxis.set_major_locator(y_major_locator)


'''
def gaussian(mu,sigma,x,b):
return 1/(np.sqrt(2*np.pi)*sigma)*np.exp(-np.square((x+b)*5-mu)/2*np.square(sigma))

plt.subplot(1,3,2)
for bi in b:
plt.plot(x,gaussian(0,1,x,bi))
plt.xlim(-1,1)
plt.ylim(0,0.4)
plt.show()
'''


def poly(x,n):
return np.power(x,n)
plt.subplot(1,3,2)
n=np.linspace(1,10,10).tolist()
for i in n:
plt.plot(x,poly(x,i))
plt.xlim(-1,1)
plt.ylim(-1,1)
ax=plt.gca()
y_major_locator1=MultipleLocator(0.5)
ax.xaxis.set_major_locator(x_major_locator)
ax.yaxis.set_major_locator(y_major_locator1)


def gaussian1(mu,sigma,x,b):
return np.exp(-np.square((x+b)*5-mu)/2*np.square(sigma))
plt.subplot(1,3,3)
for bi in b:
plt.plot(x,gaussian1(0,1,x,bi))

ax=plt.gca()
ax.xaxis.set_major_locator(x_major_locator)
ax.yaxis.set_major_locator(y_major_locator)

plt.xlim(-1,1)
plt.ylim(0,1)
plt.tight_layout()
plt.show()
image-20230317214519144

作业四 多项式拟合(加强版)

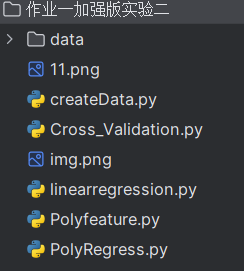
实验项目结构

image-20230326184103754 />其中,data储存固化的数据

将数据生成函数与多项式拟合功能分离,建立createData.py

交叉验证函数

线性回归

多项式特征生成和多项式回归

1
2
3
4
5
6
7
8
9
10
11
12
13
14
15
16
17
18
19
20
21
22
23
24
25
26
27
28
29
30
31
createData.py
__________________
import numpy as np
import matplotlib as plt
import pandas as pd
from sklearn.model_selection import train_test_split


# 生成数据集
def create_data(n,beta):
n = n
X = np.linspace(0, 1, n).reshape(n, 1)
noise = beta * np.random.uniform(low=-1, high=1, size=(n, 1))
t = np.sin(X * 2 * np.pi) + noise
X = X
t = t
data=np.hstack((X,t))
return data

def splitData(X,t):
X_train, X_test, T_train, T_test = train_test_split(X, t, test_size=0.2, random_state=0)
return X_train,X_test,T_train,T_test

# 数据固化
def tocsv(data):
df=pd.DataFrame(data)
df.to_csv('.\data\sample='+str(data.shape[0])+'.csv')

if __name__ == '__main__':
data=create_data(10,0.1)
tocsv(data)
1
2
3
4
5
6
7
8
9
10
11
12
13
14
15
16
17
18
19
20
21
22
23
Cross_Validation.py
_________________________________________
from sklearn.model_selection import KFold

class Cross_Validation():
def __init__(self, n_folds):
self.n_folds = n_folds


def CV(self,x,y):
kf = KFold(n_splits=self.n_folds)
x_train=[]
x_test=[]
y_train=[]
y_test=[]
for train_index,test_index in kf.split(x):
xtr, xte = x[train_index], x[test_index]
ytr, yte = y[train_index], y[test_index]
x_train.append(xtr)
x_test.append(xte)
y_train.append(ytr)
y_test.append(yte)
return x_train, x_test, y_train, y_test
1
2
3
4
5
6
7
8
9
10
11
12
13
14
15
16
linearregression.py
_______________________
import numpy as np
class linearregression():
def fit(self,x,y,Lambda=0):
c = np.dot(x.T, x)
I = np.eye(np.shape(c)[0])
d = np.dot(Lambda, I)
e = (c + d)
e = np.linalg.inv(e)
w = np.dot(x.T, y)
w = np.dot(e, w)
self.w = w
def predict(self,x):
y=np.dot(x,self.w)
return y
1
2
3
4
5
6
7
8
9
10
11
12
13
14
15
16
17
18
19
20
21
22
23
24
25
26
27
28
29
30
31
Polyfeature.py
____________________
import numpy as np

class Polyfeature():
def __init__(self,n_features):
self.n_features=n_features

# 一元特征混合
def fit(self, x):
# 单个数字
if isinstance(x,int):
x=np.array([x])
# 数组计算
xf = np.zeros((len(x), self.n_features + 1))
for i in range(self.n_features + 1):
xf[:,i] = np.power(x, i).reshape(np.shape(xf[:,i]))
self.xf=xf
return xf

def fit_transform(self,x):
# 单个数字
if isinstance(x, int):
x = np.array([x])
if isinstance(x,float):
x = np.array([x])
# 数组计算
xf = np.zeros((len(x), self.n_features + 1))
for i in range(self.n_features + 1):
xf[:, i] = np.power(x, i).reshape(np.shape(xf[:, i]))
return xf
1
2
3
4
5
6
7
8
9
10
11
12
13
14
15
16
17
18
19
20
21
22
23
24
25
26
27
28
29
30
31
32
33
34
35
36
37
38
39
40
41
42
43
44
45
46
47
48
49
50
51
52
53
54
55
56
57
58
59
60
61
62
63
64
65
66
67
68
69
70
71
72
73
74
75
76
77
78
79
80
81
82
83
84
85
86
87
88
89
90
91
92
93
94
95
96
97
98
99
100
101
102
103
104
105
106
107
108
109
110
111
112
113
114
115
116
117
118
119
120
121
122
123
124
125
126
127
PolyRegress.py
______________________________________
import math

import numpy as np
import matplotlib.pyplot as plt
import matplotlib as mpl
from mpl_toolkits.mplot3d import Axes3D
import pandas as pd
import matplotlib.ticker as mticker


from Polyfeature import Polyfeature
from linearregression import linearregression
from Cross_Validation import Cross_Validation
from createData import create_data
from createData import splitData

class polyRegression():
def __init__(self, features, n_lambda):
self.n_features = features
self.n_lambda = n_lambda

# 拟合
def fit(self,x,y,l):
# 混合特征
pf=Polyfeature(self.n_features)
pf.fit(x)
# 线性回归
lin = linearregression()
lin.fit(pf.xf,y,Lambda=l)

self.lin = lin
self.poly = pf

def predict(self,x):
x=self.poly.fit_transform(x)
prediction=self.lin.predict(x)
return prediction

def draw(self,X,t):
plt.style.use('seaborn')
plt.figure()
plt.plot(np.linspace(0,1,50),np.sin(np.linspace(0,1,50)*2*math.pi),c='green')
plt.scatter(X,t,marker='o',edgecolor='blue',c='white',linewidths=1.1)
plt.plot(np.linspace(0,1,50),
self.lin.predict(self.poly.fit_transform(np.linspace(0,1,50).reshape(-1,1))),
c='red')
s='n_features='+str(self.n_features)
plt.text(0.7,1,s)
plt.xlabel('X')
plt.ylabel('Y')
s='cv\\features='+str(self.n_features)+' samples='+str(1)+'.png'
plt.savefig('11.png')
plt.show()

def cv_pridict(self, X, y, n_fold):
cv = Cross_Validation(n_fold)
X_train, X_test, y_train, y_test = cv.CV(X,y)
y_allPredict = np.ones((1, self.n_lambda))
Lambda = np.logspace(-10, -7, self.n_lambda)
w=[]

for i in range(n_fold):
y_predict = np.zeros((y_test[i].shape[0], self.n_lambda))
k=0
for j in np.nditer(Lambda) :
print('第',k+1+self.n_lambda*i,'次:',j)
poly = self.fit(X_train[i], y_train[i], j)
y_pre = self.predict(X_test[i])
w.append(self.lin.w)
y_predict[:, k] = y_pre.ravel()
k=k+1
y_allPredict = np.vstack((y_allPredict, y_predict))
y_allPredict = y_allPredict[1:]
return y_allPredict, cv, y_test, y_train, X_test, X_train,w

def RMSE_CV(self, y_allPredict, y_measure, n):
press = np.square(np.subtract(y_allPredict, y_measure.reshape(-1,1)))
press_all = np.sum(press, axis=0)
RMSECV = np.sqrt(press_all / n)
lambda_best_index= np.argmin(RMSECV)
lambda_best=np.logspace(-10,-7, self.n_lambda)[lambda_best_index]
return RMSECV, lambda_best

def bias_cv(self, y_allPredict, y_expect, n):
press = np.square(np.subtract(y_allPredict, y_expect.reshape(-1,1)))
press_all = np.sum(press, axis=0)
bias_cv = press_all / n
return bias_cv

def variance_cv(self,y_allPredict, y_expect):
press = np.square(np.subtract(y_allPredict, y_expect.reshape(-1,1)))
variance=np.average(press,axis=0)
return variance

def test_error_cv(self,y_allPredict,y,Lambda,w):
press = np.square(np.subtract(y_allPredict, y.reshape(-1, 1)))
error1 = np.sum(press, axis=0)/2
error2 = np.linalg.norm(w,axis=1)
error_temp=[]
for i in range(100):
e=np.average(error2[i*5:(i+1)*5])
error_temp.append(e)
error2=np.array(error_temp)*Lambda/2
error=error1+error2
return error

def show_Select_lambda(self,RMSECV):
x=np.logspace(-10,-7,self.n_lambda)
plt.plot(x,
RMSECV,marker='^',
markersize=10,
markerfacecolor='orange',
color='black')
plt.xlabel('lambda')
plt.ylabel('RMSECV')
ax = plt.gca()
ax.set_xscale("log")
ax.set_xlim(ax.get_xlim()[::-1])

def RSME(self,X,t):
T_predict = self.lin.predict(self.poly.fit_transform(X))
SSE = np.sum(np.square(t - T_predict))
MSE = SSE / len(T_predict)
rsme = np.sqrt(MSE)
return rsme

调整\(\beta\)\(\lambda\)观察RMSE变化

代码如下:

1
2
3
4
5
6
7
8
9
10
11
12
13
14
15
16
17
18
19
20
21
22
23
if __name__=='__name__':
beta=np.linspace(0,0.5,1000)
Lambda=np.logspace(-10,0,1000)
RMSE_SUM=[]
# beta和lambda对拟合效果影响
for j in beta:
poly = polyRegression(8, 1000)
data=create_data(10,j)
X=data[:,0]
t=data[:,1]
y_allPredict, cv, y_test, y_train, X_test, X_train = poly.cv_pridict(X, t, 5)
RMSECV, best_lambda = poly.RMSE_CV(y_allPredict, t, X.shape[0])
RMSE_SUM.append(RMSECV)
RMSE=np.array(RMSE_SUM)
X, Y = np.meshgrid(Lambda, beta)
fig = plt.figure(figsize=(15,15))
ax = plt.axes(projection='3d')
ax.set_xlabel('beta')
ax.set_ylabel('lambda')
ax.set_zlabel('RSME')
ax.plot_surface(np.log(Y), np.log(X), RMSE, rstride=1, cstride=1, cmap=plt.get_cmap('rainbow'))
ax.set_title('Surface plot')
plt.show()
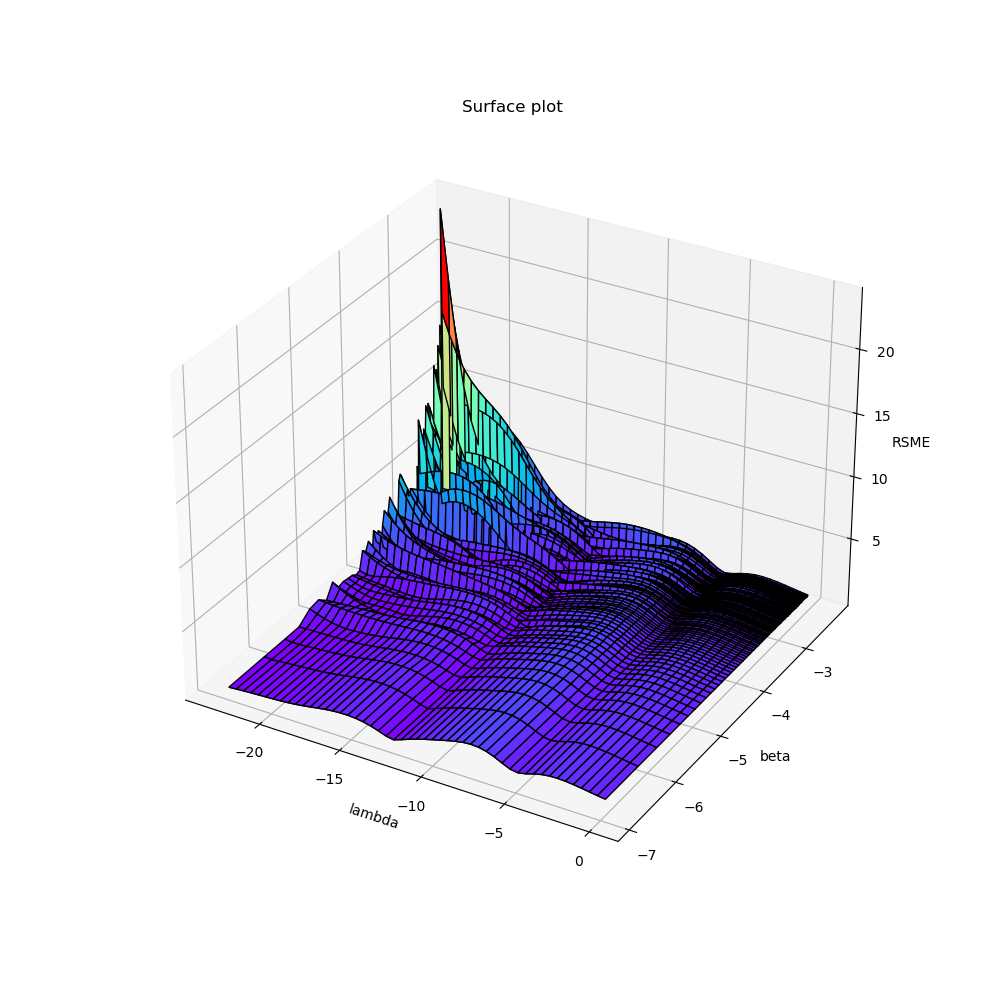
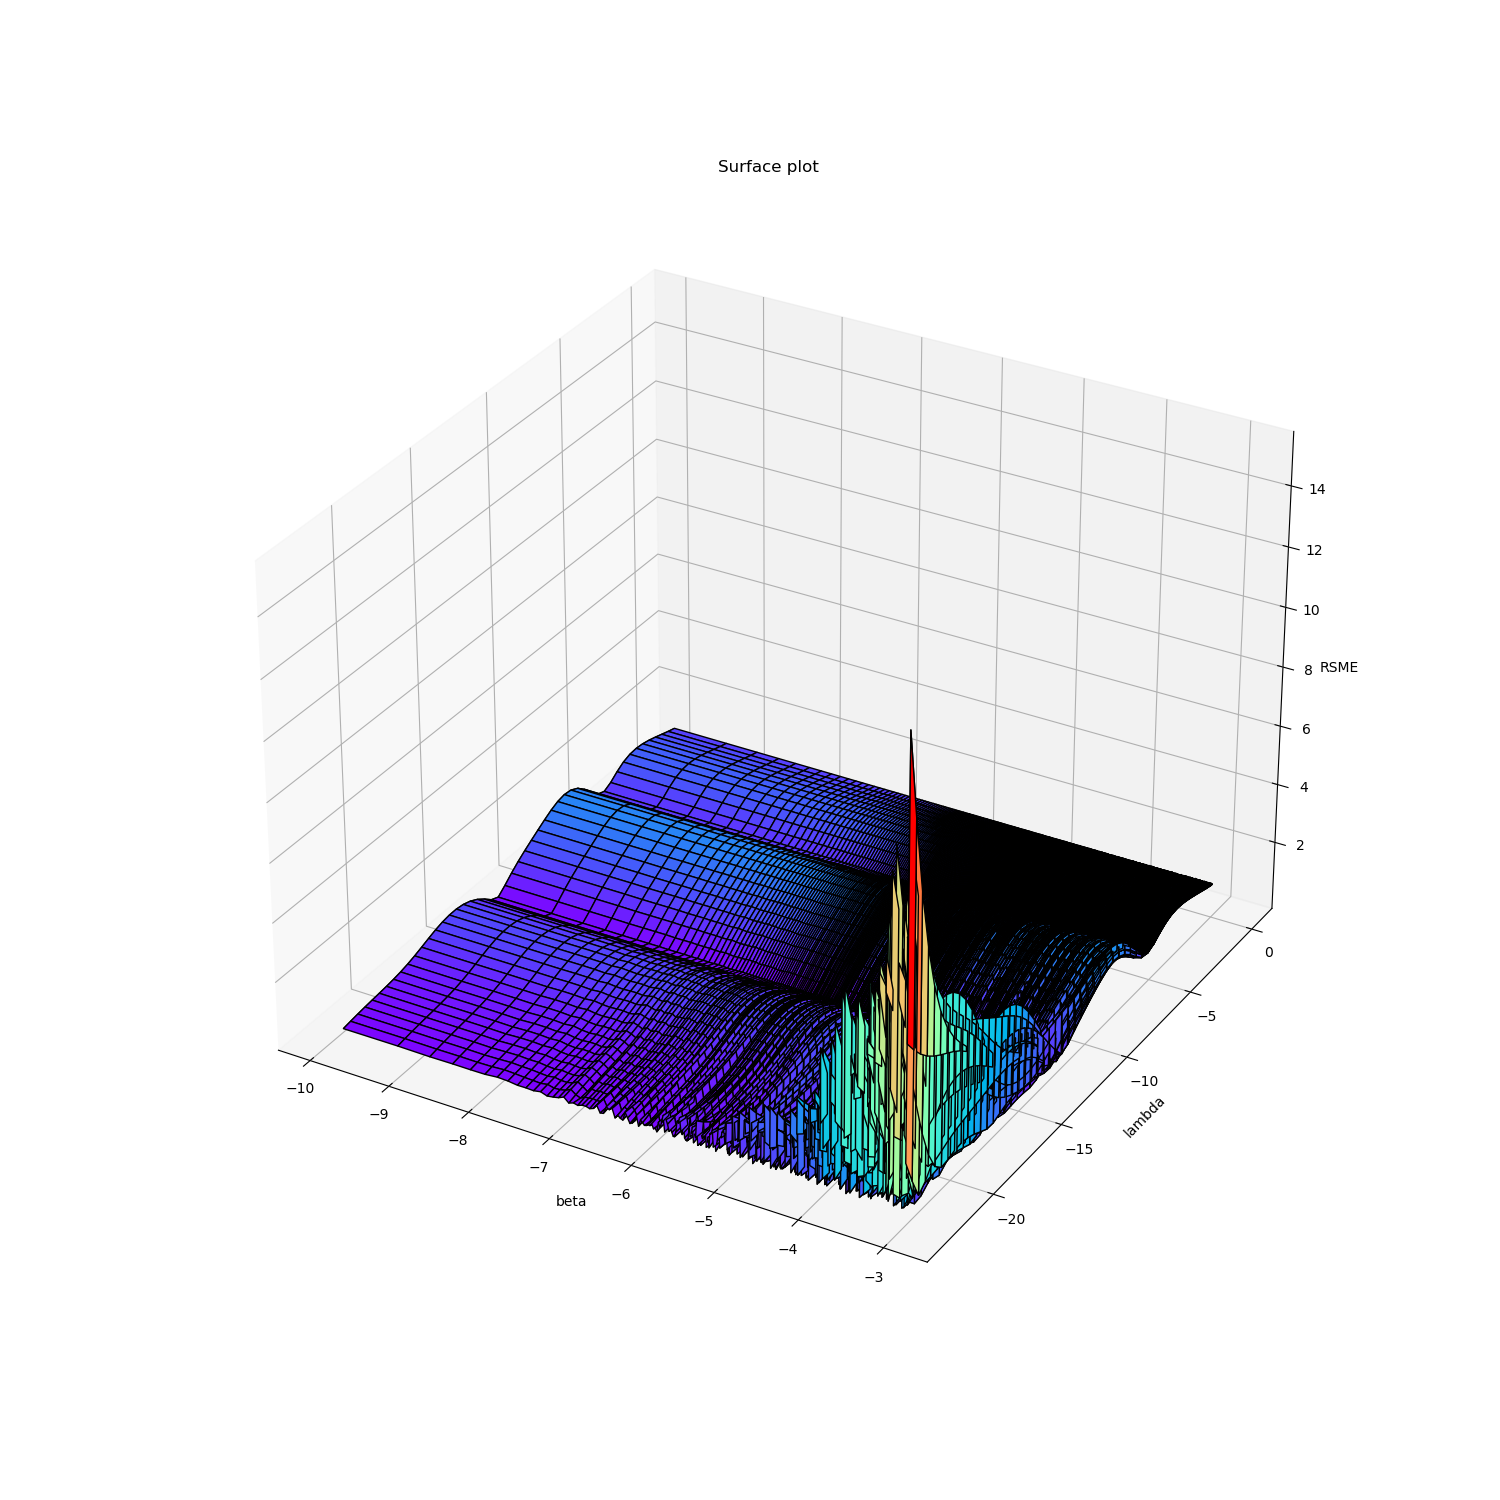
image-20230323215538367 image-20230323220045143

右图\(-\ln \beta\)值作为x轴,\(\ln \lambda\)作为y轴,左图反之。

为了方便观察,对局部作图:

img

首先,从\(\ln \lambda\)方向观察,可以看出\(\lambda\)对RMSE的影响呈波浪状,存在多个极小值,当\(\lambda\)取很小的值时,在\(-ln\beta\)较大的时候出现了比较严重的过拟合。

然后从\(-\ln \beta\)方向观察,可以看出\(\beta\)对RMSE的影响实际上并不大,呈小而密的波浪趋势。

正则化前后回归系数

代码如下:

1
2
3
4
5
6
7
8
9
10
11
12
13
14
15
16
17
18
19
20
21
22
23
# 选择参数lambda,给出拟合表达
df=pd.read_csv('./data/sample=10.csv')
X=df.values[:,1]
t=df.values[:,2]
x_train, x_test, T_train, T_test=splitData(X,t)
# 正则化
for i in range(10):
poly = polyRegression(i, 50)
y_allPredict, cv, y_test, y_train, X_test, X_train = poly.cv_pridict(X, t, 5)
RMSECV, best_lambda = poly.RMSE_CV(y_allPredict, t, X.shape[0])
poly_best=polyRegression(i,5)
poly_best.fit(x_train,T_train,best_lambda)
print('次数为',i,'时的权重集合:')
print(poly_best.lin.w)
# 无正则化
print("无正则化\n")
for i in range(10):
poly = polyRegression(i, 50)
poly.fit(x_train, T_train, 0)
print('次数为', i, '时的权重集合:')
print(poly.lin.w)
rmse_train=[]
rmse_test=[]

无正则化:

\(w\) 0 1 2 3 …… 9
-0.08673405 0.43162238 0.5695881 -0.05816218 -0.07491257
-1.05343403 -2.17473669 11.14510403 10.41748047
1.16724815 -33.31060868 -34.4765625
22.29544252 56.09375
-60.
-14.375
34.796875
44.5625
-2.0625
-35.390625

正则化后:

\(w\) 0 1 2 3 …… 9
-0.07776724 0.15514244 0.17544013 0.33805469 0.21515437
-0.52292037 -0.38363097 -0.80726911 -0.44372143
-0.25709792 -0.42717323 -0.42050595
0.41092392 -0.25649878
-0.10138744
0.02127489
0.1134249
0.1815334
0.23170656
0.26874031

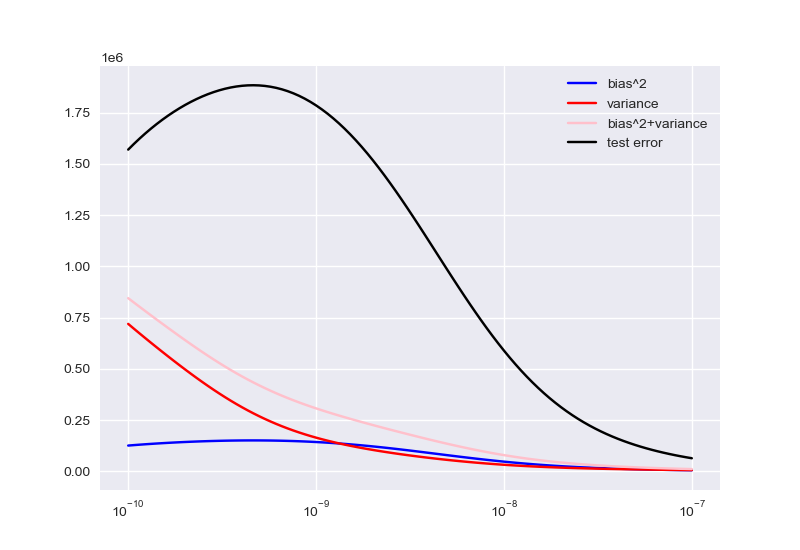
bias-variance结构

程序如下:

1
2
3
4
5
6
7
8
9
10
11
12
13
14
15
16
17
18
19
20
21
22
23
24
25
26
27
28
29
30
31
32
33
34
35
36
37
38
39
40
41
42
43
44
45
46
47
48
# 期望计算
predictAll=[]
T11=[]
for i in range(100):
data1 = create_data(25, np.random.uniform(0,0.5))
X1 = data1[:,0]
t1 = data1[:,1]
x1_train, x1_test, T1_train, T1_test = splitData(X1, t1)
poly_evey=polyRegression(25,100)
y_allPredict, cv, y_test, y_train, X_test, X_train,w = poly_evey.cv_pridict(X1, t1, 5)
predictAll.append(y_allPredict)
RMSECV, best_lambda = poly_evey.RMSE_CV(y_allPredict, t1, X1.shape[0])
poly_evey.fit(x1_train,T1_train,best_lambda)
t_predict=poly_evey.predict(X1)
T11.append(t_predict)

T1=np.array(T11)
f_hat=np.average(T1,axis=0)
poly11=polyRegression(25,100)
variances=[]
for i in predictAll:
variance=poly11.variance_cv(i,f_hat)
variances.append(variance)
variance=np.average(variances,axis=0)

# 生成一个新数据集
data2 = create_data(25, np.random.uniform(0, 0.5))
X2 = data2[:, 0]
t2 = data2[:, 1]
x2_train, x2_test, T2_train, T2_test = splitData(X2, t2)
poly2=polyRegression(25,100)
y_allPredict, cv, y_test, y_train, X_test, X_train, w = poly2.cv_pridict(X2, t2, 5)
RMSECV, best_lambda = poly2.RMSE_CV(y_allPredict, t2, X2.shape[0])
poly2.show_Select_lambda(RMSECV)
bias_2=poly2.bias_cv(y_allPredict,f_hat,X2.shape[0])
w=np.array(w)
error=poly2.test_error_cv(y_allPredict,t2,np.logspace(-10,-7,100),w)
print(bias_2)

plt.figure()
plt.plot(np.logspace(-10,-7, 100),bias_2,label='bias^2',color='blue')
plt.plot(np.logspace(-10,-7, 100),variance, label='variance', color='red')
plt.plot(np.logspace(-10,-7, 100),bias_2+variance, label='bias^2+variance', color='pink')
plt.plot(np.logspace(-10,-7, 100),error,label='test error', color='black')
ax = plt.gca()
ax.set_xscale("log")
plt.legend()
plt.show()

image-20230326185731318

\(degree\)\(lambda\)寻优过程

1
2
3
4
5
6
7
8
9
10
11
12
13
14
15
16
17
18
19
20
21
22
23
24
25
26
27
28
29
30
31
32
33
34
35
36
37
38
39
40
41
42
43
44
45
46
rmse_train=[]
rmse_test=[]
# 寻找最优次数
for i in range(10):
poly = polyRegression(i, 50)
poly.fit(x_train,T_train,0)
rmse_train.append(poly.RSME(x_train,T_train))
rmse_test.append(poly.RSME(x_test,T_test))
plt.style.use('seaborn')
plt.figure()
plt.plot(np.linspace(0,10,10),
rmse_test,
label='test',
marker='o',
markerfacecolor='white'
, markeredgecolor='b',
color='b',
markeredgewidth=1.5)
plt.plot(np.linspace(0,10,10),rmse_train,
label='train',
marker='o',
markerfacecolor='white',
markeredgecolor='r',
color='r',
markeredgewidth=1.5)
plt.ylabel('RMSE')
plt.xlabel('degree')
plt.tight_layout()
plt.legend()
plt.show()
best_degree=np.argmin(np.array(rmse_test))
print('best degree is',best_degree)
print('min RMSE in test sets:',np.min(rmse_test))

# 对最优次数寻找合适的lambda
poly = polyRegression(best_degree, 50)
poly.fit(x_train, T_train, 0)
poly.draw(X,t)
y_allPredict, cv, y_test, y_train, X_test, X_train,w = poly.cv_pridict(X, t, 5)
RMSECV, best_lambda = poly.RMSE_CV(y_allPredict, t, X.shape[0])
poly.show_Select_lambda(RMSECV)
print('best lambda is',best_lambda)
print('min RMSE with regularization:',np.min(RMSECV))
poly_best = polyRegression(best_degree, 50)
poly_best.fit(x_train, T_train, best_lambda)
poly_best.draw(X, t)

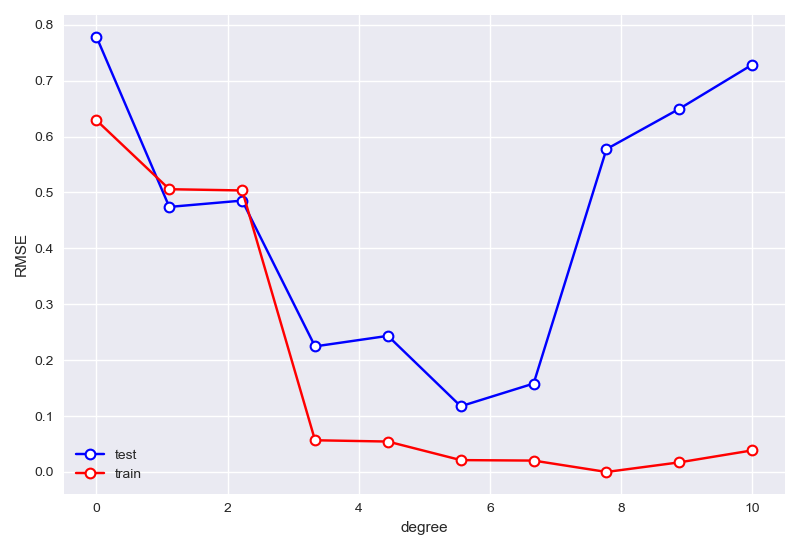
degree寻优:

image-20230326191813731

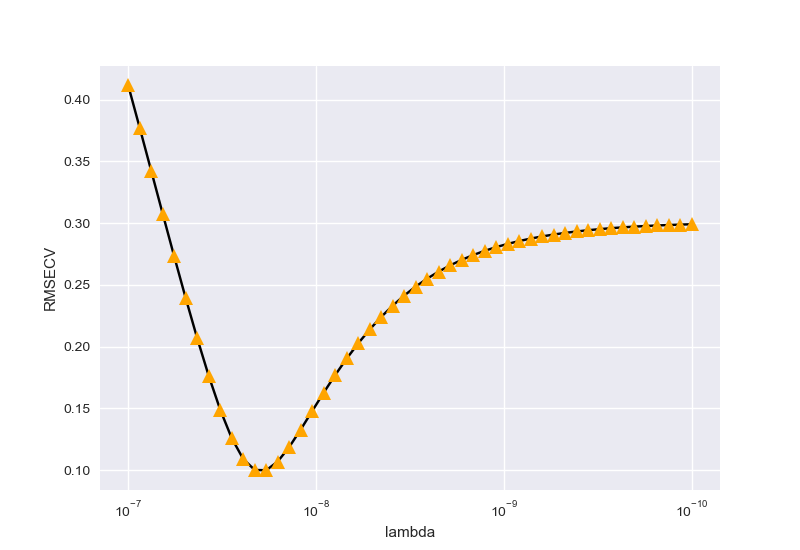
\(lambda\)寻优:

image-20230326191840244

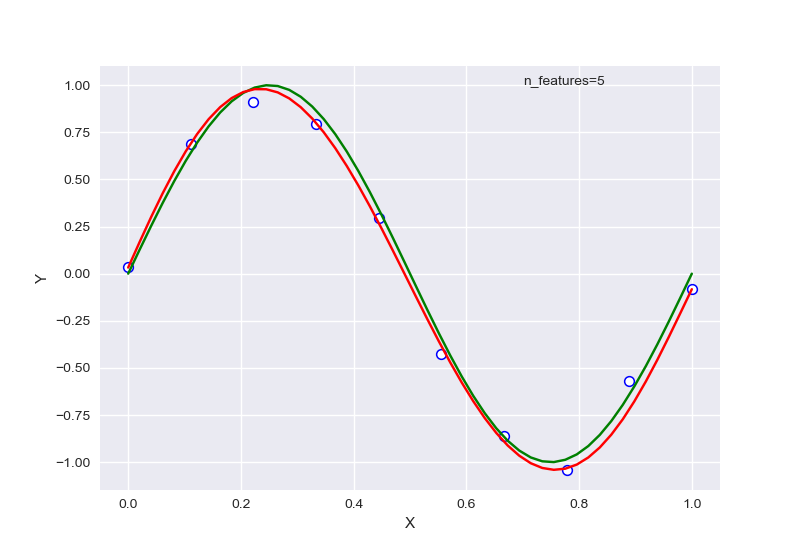
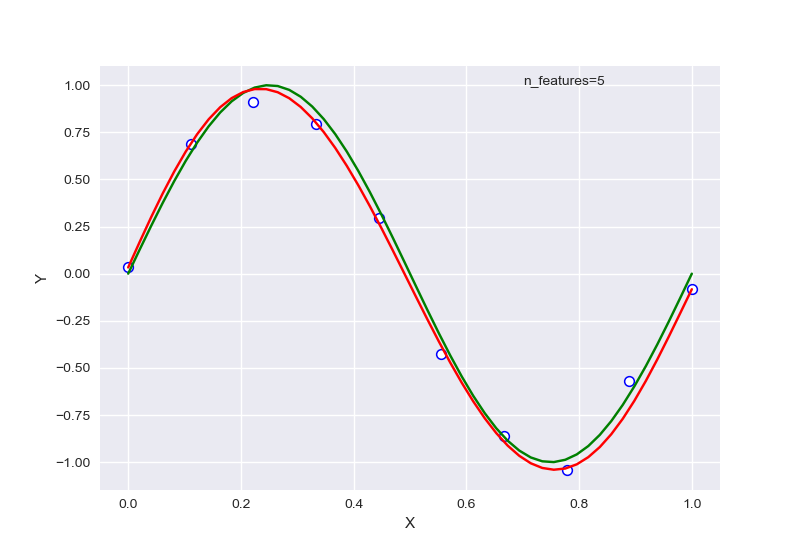
正则化前后图像对比:
image-20230326191928367 image-20230326191912106

左图为未正则化,右图为正则化后。输出结果为:

1
2
3
4
best degree is 5
min RMSE in test sets: 0.11753272730633338
best lambda is 1.8420699693267162e-08
min RMSE with regularization: 0.0998645060490816

样本数目影响

代码如下:

1
2
3
4
5
6
7
8
9
10
11
12
13
14
15
16
17
18
RMSEs=[]
for i in range(10,50):
data=create_data(i,0.25)
X=data[:,0]
t=data[:,1]
X_train, X_test, T_train, T_test=splitData(X,t)
poly=polyRegression(8,50)
poly.fit(X_train,T_train,0)
rmse=poly.RSME(X,t)
RMSEs.append(rmse)

plt.style.use('seaborn')
plt.figure()
plt.plot(np.linspace(10,50,40),RMSEs)
plt.ylabel("RMSE")
plt.xlabel('samples')
plt.tight_layout()
plt.show()

image-20230326193335597

image-20230326193511771

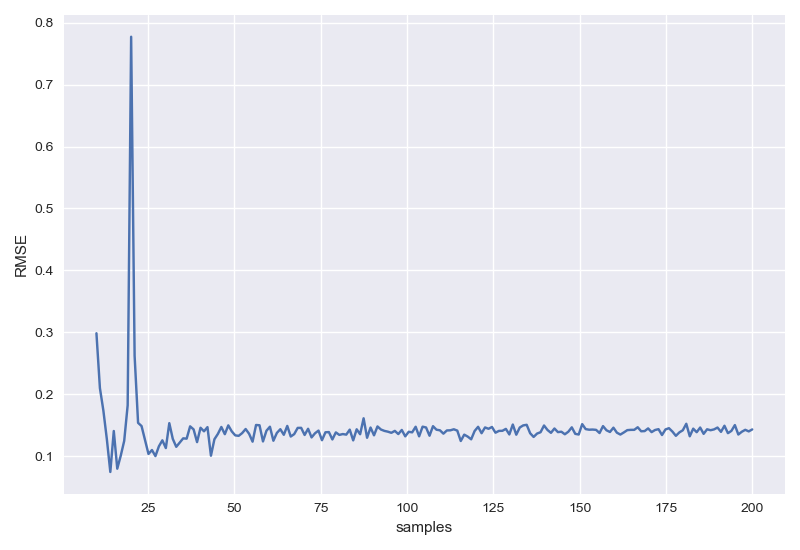
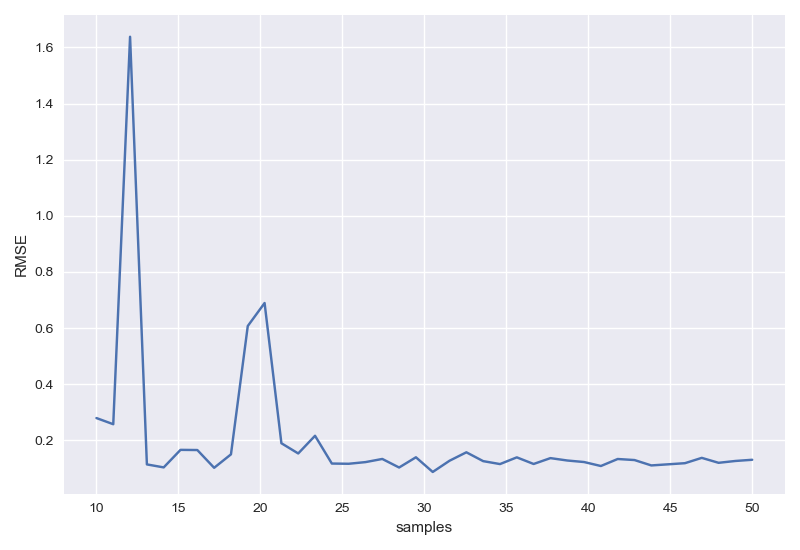
上图是样本数量在(10,200)的RMSE图,下图是样本数量在(10,20)的RMSE图,可以明显看出随着样布数目增长RMSE逐渐趋于稳定,仅有很小的波动。